
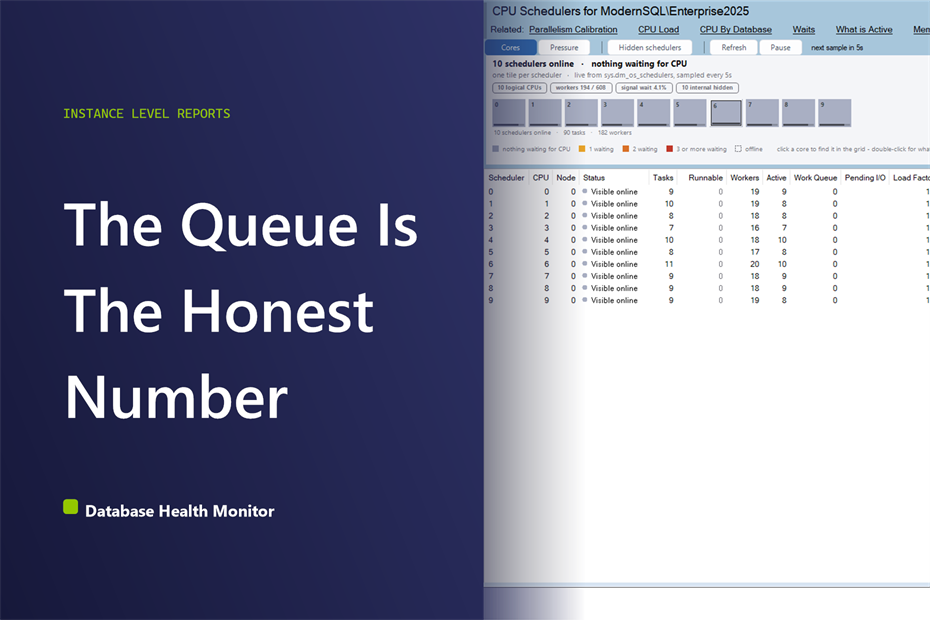
Why SQL Server CPU Pressure Isn’t What Task Manager Shows
Task Manager’s CPU percentage hides real CPU pressure. Learn which SQL Server counter shows it and what a healthy loaded server actually looks like.
Task Manager’s CPU percentage hides real CPU pressure. Learn which SQL Server counter shows it and what a healthy loaded server actually looks like.
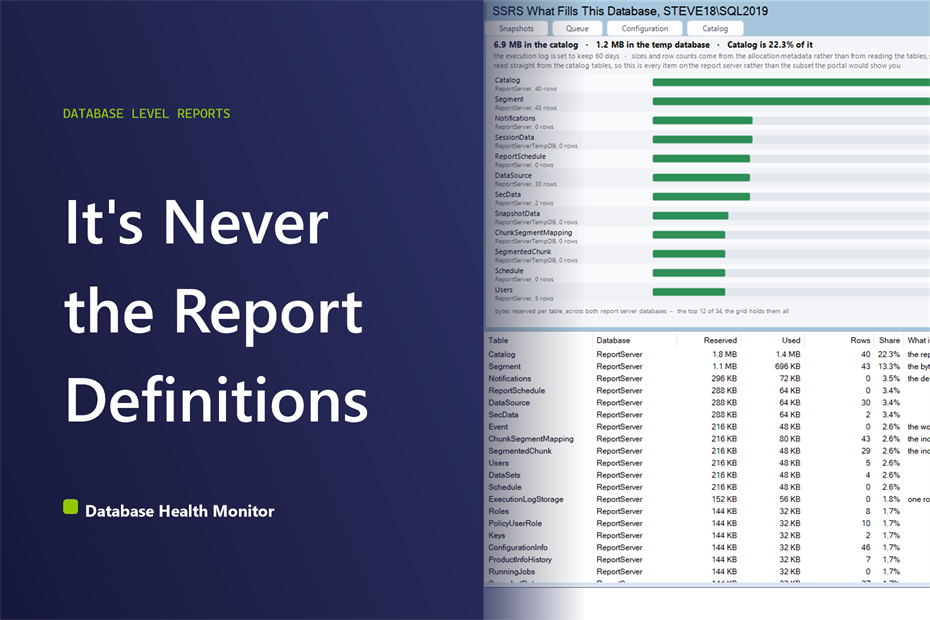
ReportServer database size rarely grows from report definitions. See which tables, in the catalog and its temp database, actually reserve the space.
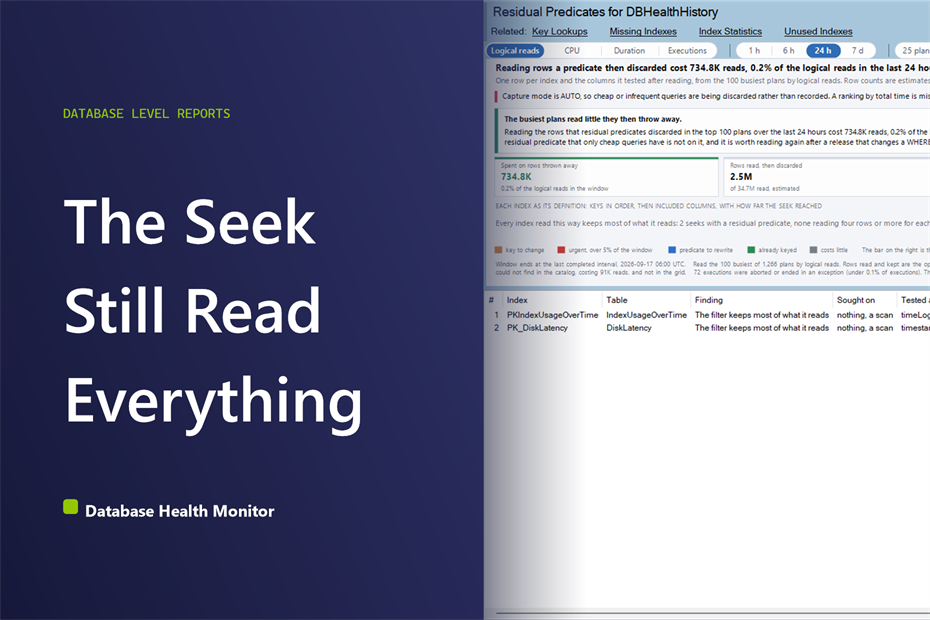
A SQL Server residual predicate lets an index seek report success while it reads and discards most of the rows it touched. Here’s how to… Read More »The SQL Server Residual Predicate Hiding in Your Plan
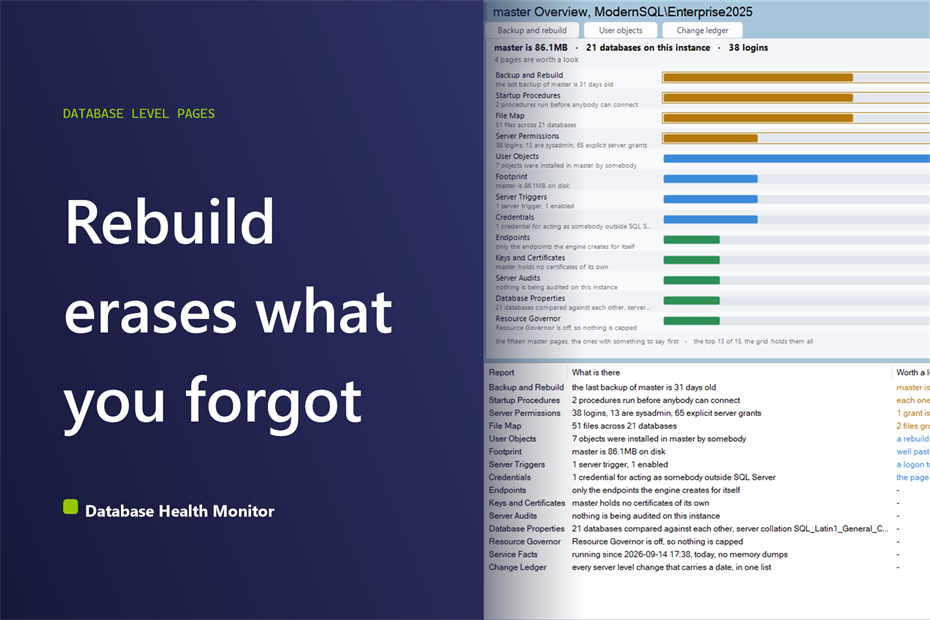
What is in master often surprises the team that has to rebuild it: credentials, triggers, and startup procedures nobody documented.
Database Health Monitor 4.1540 adds 63 reports, 25 features and 515 bug fixes. Here is what that release actually means for a consulting practice or… Read More »What a 515-Bug-Fix Release Says About the SQL Server Estate You Cannot See
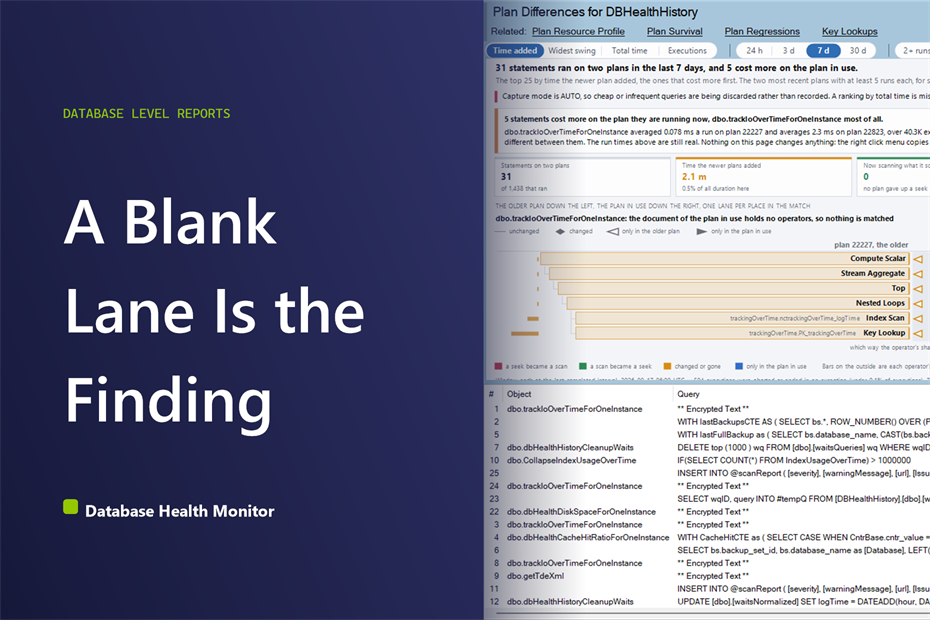
See what changed in the query plan the moment SQL Server switches to a new one, lane by lane, before you force the old plan… Read More »What Changed in the Query Plan Before It Got Slower
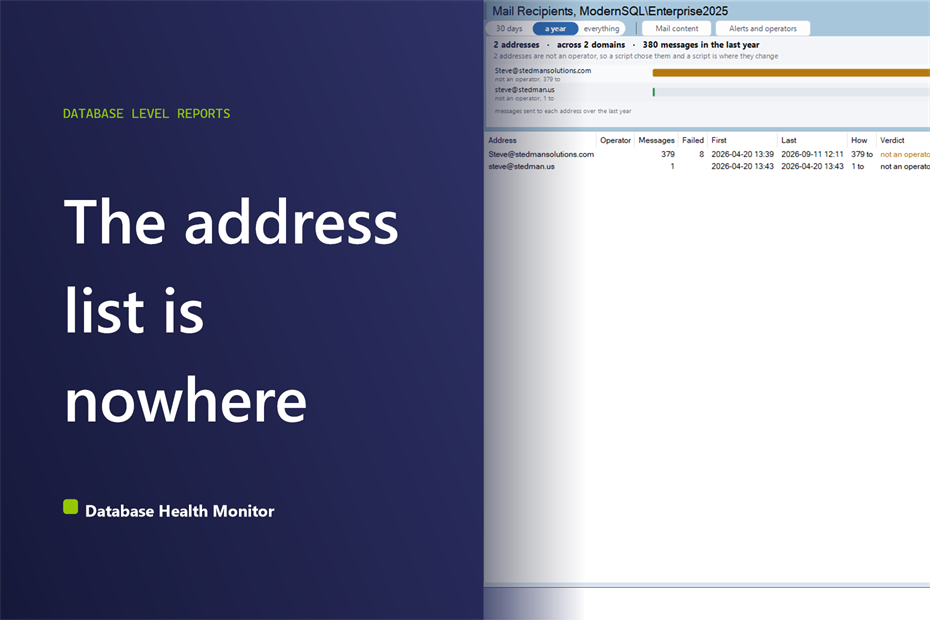
Who gets SQL Server email? Operators are only part of the answer. Learn how to find every address, the leavers and the dead mailboxes.
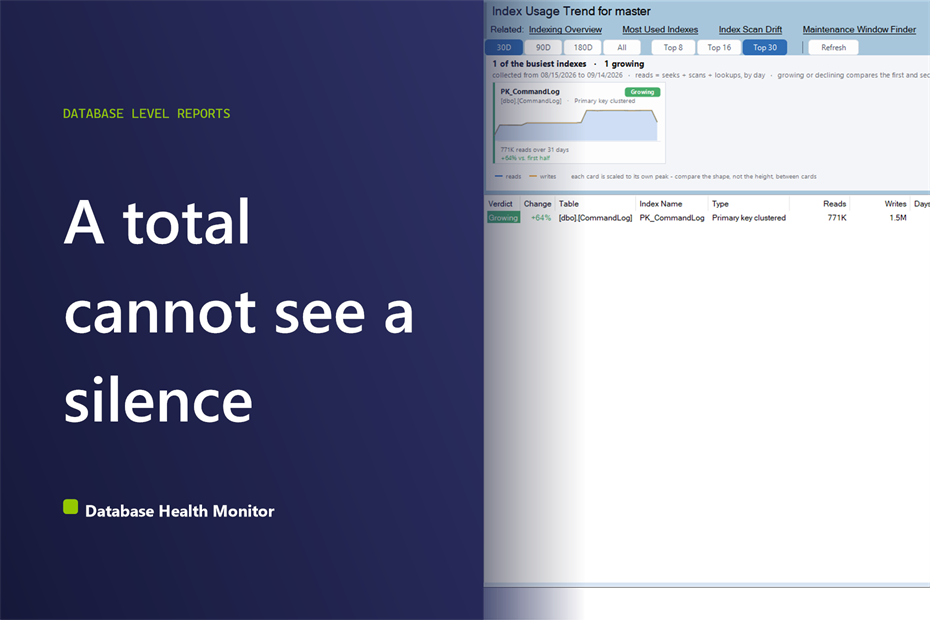
Is this index still used? A lifetime read count cannot say. Here is how a per-index trend line catches an index that went silent weeks… Read More »Is This Index Still Used? Read the Trend, Not the Total
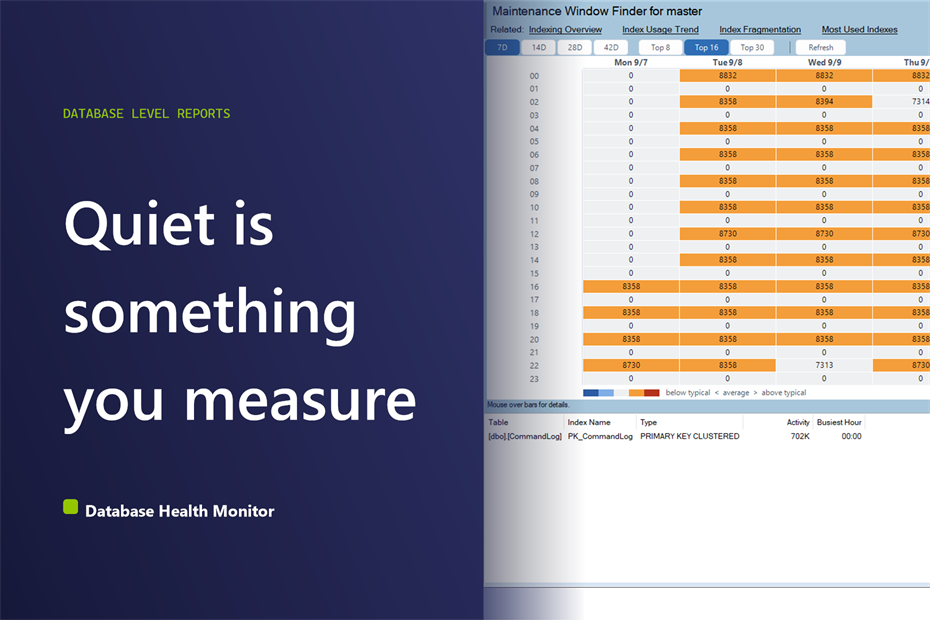
Most SQL Server maintenance window schedules are typed in once and never checked. Here is how to measure the quiet hours instead of guessing at… Read More »Your SQL Server Maintenance Window Is a Guess. Measure It
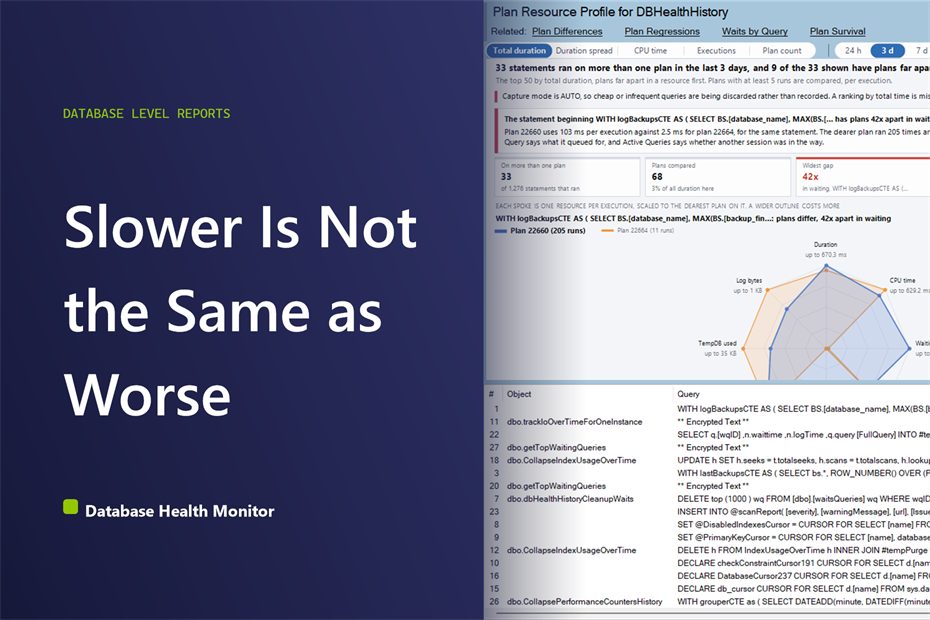
Why is one execution plan slower than another for the same SQL Server query? See which Query Store measures explain the gap, not just duration.