
A query regressed last Tuesday and the Top Resource Consumers page says nothing happened. The chart is drawn. The bars are sorted. Every number is where it should be. The store behind it may have stopped collecting days earlier, and Query Store stopped collecting without raising a single error.
How do I know if Query Store stopped collecting on my SQL Server database? Compare the history Query Store actually holds with the retention you configured. Check the actual operation mode, storage against MAX_STORAGE_SIZE_MB, the age of the oldest and newest completed intervals, and any gaps between them. A store can read READ_WRITE while full, idle, or full of holes, and no error is raised.
That pattern is what Database Health Monitor was built to catch, and the Query Store Health report is the page that catches it. This post explains why the problem hides so well and what to measure instead of the setting everybody checks.
In this post
- Why a stopped store still looks healthy
- The setting everyone checks, and how it misleads
- Measure the history, not the switch
- How to tell Query Store stopped collecting
- Two dials that carry the argument
- Reading the grid, row by row
- What to do with the answer
- Questions we hear most
Why a stopped store still looks healthy
We see the same story at shop after shop. Somebody enables Query Store, sees good data for a week, and never thinks about it again. Months later a tuning session leans on it, and the data is wrong in a way that is hard to notice.
Here is the mechanism. The catalog views stay fully readable after collection ends. Ask for the last 24 hours and you get the last 24 hours the store knew about, which might be nine days ago. The page does not warn you. It has no empty state to show, because there is data, just old data.
The cost is real and it is quiet. A team spends an afternoon tuning the wrong query. A change gets blamed for a regression it did not cause. A forced plan is trusted when the store has been dark since before the last deployment.
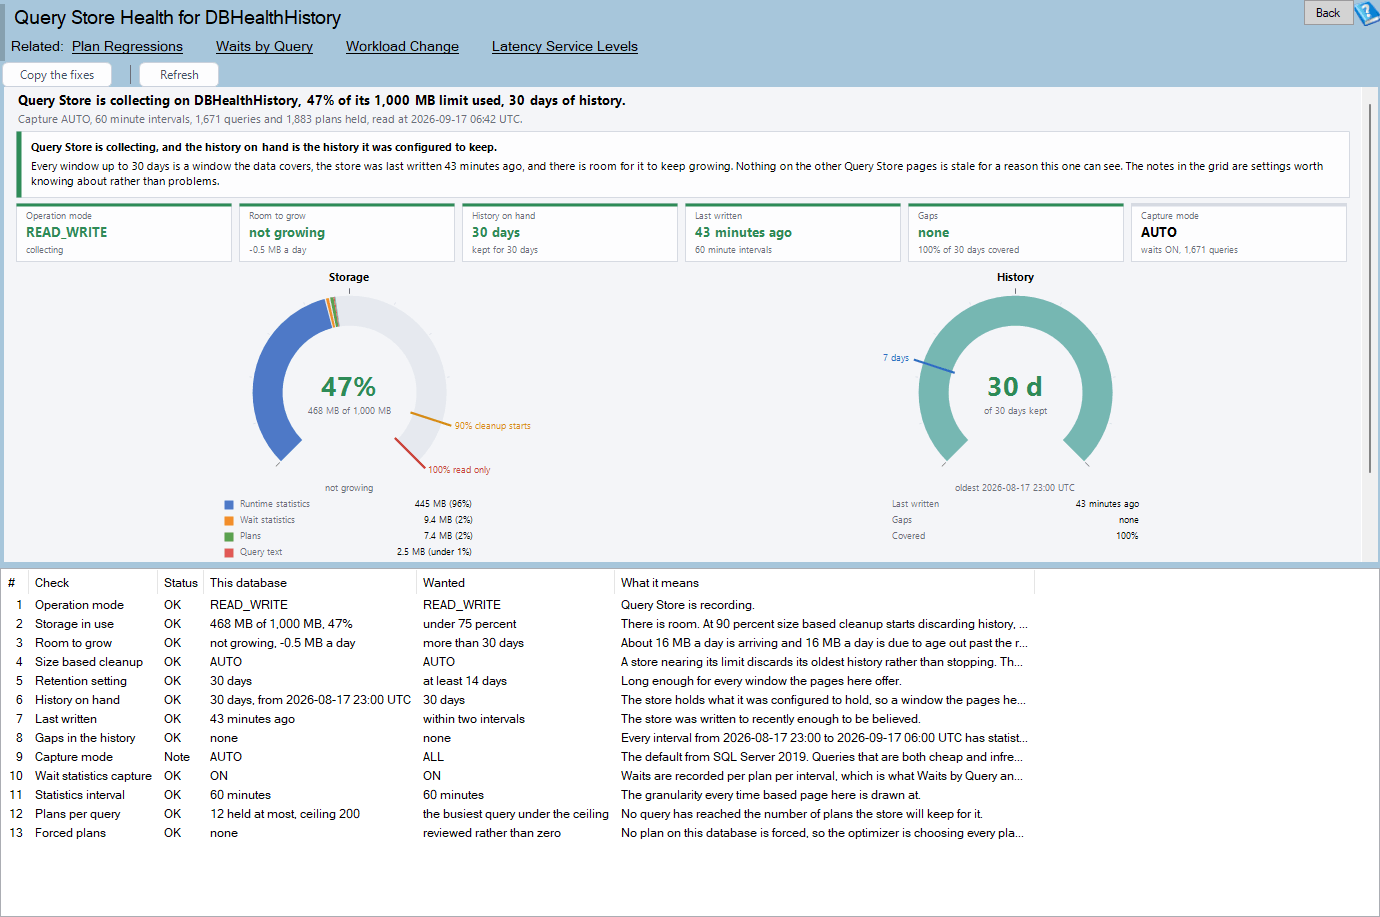
Query Store Health is one of the reports in Database Health Monitor. It runs against your own servers, and it takes about a minute to have this same screen open on one of them.
The setting everyone checks, and how it misleads
The first thing most people do is look at the state. Right-click the database, open the Query Store page, see READ_WRITE, move on. It is a reasonable instinct. It is also the least reliable answer available, because the common failures leave that line untouched.
Consider four ways a store goes quiet while still reading READ_WRITE.
- The store fills. Near 90 percent of
MAX_STORAGE_SIZE_MB, cleanup begins throwing history away. At 100 percent the store flips itself to READ_ONLY. Before SQL Server 2019 the default limit was only 100 MB, so a database set to keep 30 days and holding four is not misconfigured. It is simply full. - Collection has holes. An interval is written only when something ran. Nothing is written while the store is off, read only, or the instance is down. A week with a two day hole reads as a complete week on every page that adds it up.
- Waits are a separate switch. With
WAIT_STATS_CAPTURE_MODEoff, Waits by Query and Load Sensitivity show a database that never waited on anything. - Capture is selective. AUTO, the default from SQL Server 2019, skips cheap and infrequent queries. A query that is missing from the page is not proof it never ran.
Four failures, one reassuring status line. That is the trap.
Measure the history, not the switch
The honest number is not the state. It is the history you really hold, set against the history you were promised. Retention says 30 days. How far back does the oldest completed interval actually go? If the answer is four, the store is lying by omission, and the other pages inherit that lie.
Two things can explain the gap, and they point in opposite directions. When the store is nearly full and cleanup is on, size based cleanup is discarding history early, so you raise the limit. When the store has plenty of room, it is young or was cleared recently, so you wait or look at who cleared it. Same symptom, different fix. Only the measurement tells them apart.
Storage deserves the same treatment. A percentage today is a snapshot. What you want is the days of room left at the current growth rate, because a store at 60 percent that is adding history quickly is closer to trouble than one at 80 percent that has leveled off. Once a store reaches its retention window, roughly as much ages out each day as arrives. Flat growth there is correct, not a sign of a problem.
Then there is recency. A store that has not completed an interval in a couple of intervals plus a flush is either sitting on an idle database or has stopped recording work that is happening. Those are very different afternoons. The difference is the last user read or write on a user table, which the page pulls from sys.dm_db_index_usage_stats. That check needs VIEW SERVER STATE. Without it the page says plainly that it cannot tell.
How to tell Query Store stopped collecting
Open the Query Store folder for a database in the tree, or go to Real Time, then Query Store, then Query Store Health. It works whether the store is on, off, or read only, on SQL Server 2016 and newer. The folder is hidden on master and tempdb, where Query Store cannot be turned on at all.
The top of the page is a verdict. It answers the one question anybody opens it with: can I trust the other Query Store pages? It leads with the worst problem. On a store that is OFF or READ_ONLY it also tells you how much history is still there and when it ends, which is the detail you need before deciding how far back any ranking can be believed.
Below it sit six tiles. Operation mode. Room to grow. History on hand. Last written. Gaps. Capture mode. Click a tile and the matching row in the grid is selected.
Two dials that carry the argument
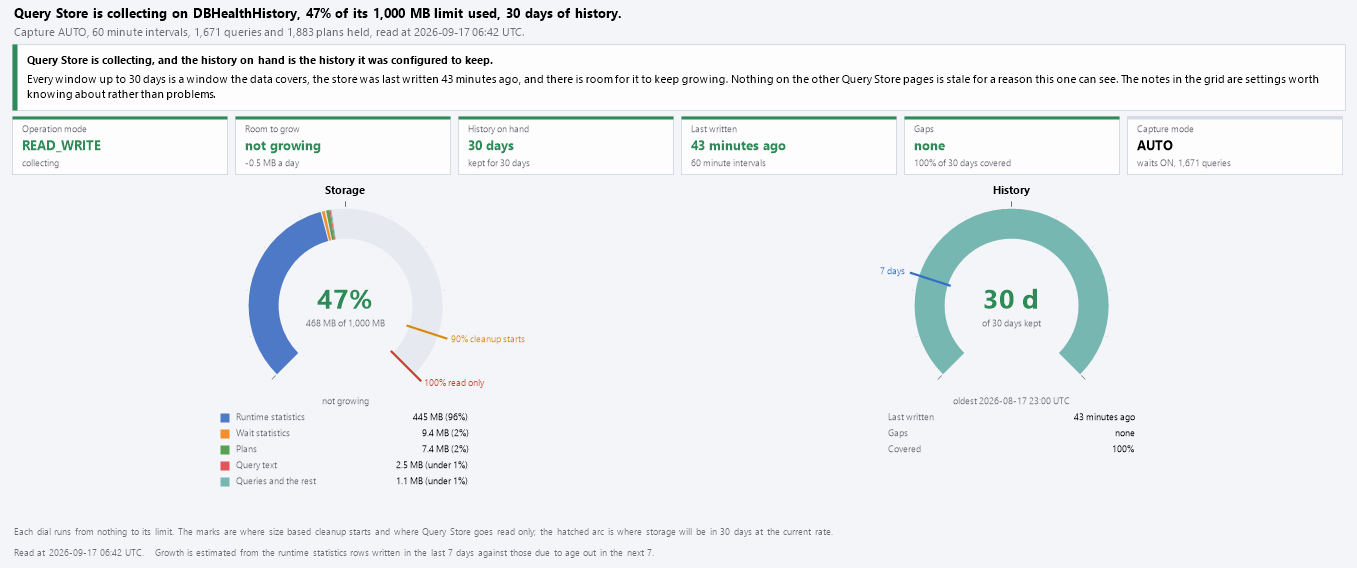
The chart is a pair of gauges. Each one runs from zero to its own ceiling, so a 1,000 MB store and a 30 day retention setting can be compared by eye.
The storage dial fills against MAX_STORAGE_SIZE_MB. The fill is broken down by what is eating the space: runtime statistics, wait statistics, plans, query text and everything else, in MB, measured from the internal tables. An amber mark at 90 percent is where cleanup starts. A red mark at 100 percent is where the store turns READ_ONLY. A hatched arc ahead of the fill projects where you will be in 30 days. It is left off when the store is not growing.
The dial can show more than 100 percent. Query Store may overshoot its limit before it notices, so the fill stops at the end of the scale while the number in the middle tells you how far over you are.
The history dial compares days on hand with STALE_QUERY_THRESHOLD_DAYS. A full dial means the store holds what it was set to hold. A blue mark at 7 days shows whether the longest window most pages offer is covered. If that mark sits outside the fill, a weekly ranking is built on less than a week.
Reading the grid, row by row
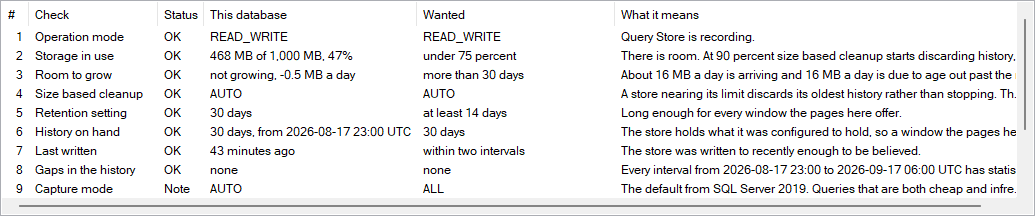
The grid has one row per check, in the order you would reason about them: the operation mode before the storage that decides it, and the retention setting right before the measurement that contradicts it. Each row has a status of OK, Note, Warning or Problem, a reading from your database, the value a healthy store would show, and a plain statement of what leaving it alone costs the other pages.
A few thresholds are worth knowing, because they tell you how seriously to take a color.
| Check | When it fires |
|---|---|
| Storage in use | Warning from 75 percent, Problem from 90 |
| Room to grow | Warning under 30 days, Problem under 7 |
| Retention setting | Note under 14 days, Warning under 7 |
| Capture mode | ALL is what ranking pages want, AUTO and CUSTOM are Notes, NONE is a Problem |
| Gaps in the history | Scattered short holes are a Note, a hole of a day or more is a Warning |
That last one saves a lot of panic. Gaps every night usually mean the database is idle overnight, so there was nothing to write. A single hole of a day or more is the one worth chasing, because it points at a stopped store or an instance that was down. Right-click the row and the report lists every hole, newest first.
Other rows catch quieter damage. A statistics interval set to a full day hides when anything happened inside it. A query sitting at its MAX_PLANS_PER_QUERY ceiling has plans that are no longer being recorded. A forced plan that keeps failing to force is a promise the engine is not keeping. Double-click any row to read the check in full.
What to do with the answer
Start with the reason, not the button. A READ_ONLY store has a decoded readonly_reason. When it is the size quota, the fix is to raise the limit and set READ_WRITE. When the database itself is read only, nothing on this page fixes it, and you need to look at why the database got there.
The report writes the remedies as ALTER DATABASE statements. Copy the fixes puts every suggested change on the clipboard and runs nothing. The only action that touches your server is Turn Query Store on or Fix Query Store, and that one shows the statement and asks first. We think that is the right posture for a production change: read it, then decide.
Once the store is healthy, the follow-up reports make sense again. Confirm wait capture is on before you open Waits by Query. Check plans per query before Plan Regressions. If capture mode ALL is stuffing the store with single use statements, One Time Use Queries is the place to look. Workload Change needs 14 days of history to compare one week with the one before it, so a short history reading on this page tells you not to bother yet.
History also matters for trend work. If you want to see how a particular hour has drifted, Which Hour of the Day Is Slower Than It Used to Be? walks through that on a store you can trust. Run the health check first. Trend lines drawn over a hole mislead as confidently as anything else.
The full column and check reference lives on the Query Store Health help page, including the SQL Server version notes. The wait statistics check needs SQL Server 2017 or newer, and on 2016 the page tells you so.
Questions we hear most
Retention says 30 days but history on hand says 4. Which is right? Both. One is what you asked for and the other is what you have. If the store is nearly full, cleanup is discarding history to make room, so raise the limit. If it has room, it has only been collecting for 4 days or was cleared then.
Why is room to grow "not growing" on a busy database? Because the store has reached its retention window. About as much ages out each day as arrives, and the estimate compares the two.
Do the fix buttons change anything silently? No. Copying puts text on the clipboard. The one button that runs a statement shows it to you first.
The real lesson is small. A tuning page is only as good as the interval data under it, and nothing in SQL Server volunteers that the data stopped. Somebody has to ask. Better that it is you, on a quiet morning, than a regression review on a bad one.
What to check on your own server
- Run a SELECT against sys.database_query_store_options and compare actual_state_desc with desired_state_desc on each database
- Compare current_storage_size_mb with max_storage_size_mb and note any database above 75 percent
- Compare stale_query_threshold_days with the age of the oldest completed interval in sys.query_store_runtime_stats_interval
- Look for a gap of a day or more between consecutive intervals, and ask what was happening on the instance then
- Check whether wait statistics capture is on before you trust any wait ranking
Try Database Health Monitor Today
A Query Store that quietly stopped, filled up, or collected with holes makes every ranking built on it a confident guess, and this report checks before you trust one. Database Health Monitor shows it on every instance you connect, in the time it takes to open the report.
Download Database Health Monitor and run the Query Store Health report against your own server. There is nothing to configure first, and you will know inside a few minutes whether it tells you something you did not already know.