
Across many client servers we keep meeting the same quiet confidence: the backup job is green, the last backup date is from last night, and nobody has looked further. Then a database fails and the restore needs a log chain that stopped four days ago. SQL Server backup status is not a date. It is a promise about what you can get back, and a date cannot keep it.
How do I check SQL Server backup status and know how much data I would lose? SQL Server backup status is best judged by exposure, meaning how much data a database would lose if it failed right now, not by the date of its last backup. Exposure is measured in time from the newest real recovery point, and four faults, such as a broken log chain, override a recent date.
We use Database Health Monitor to answer that properly, and the rest of this post explains what it measures and why.
In this post
- Why the last backup date misleads you
- Exposure: the honest number
- Each database is judged against its own target
- Reading SQL Server backup status in five minutes
- Row counts lie, so check coverage and the restore plan
- What the report refuses to hide
- What to do with the answer
Why the last backup date misleads you
Most backup reports answer one question: when was the last backup? It feels like the right question. It is not. The question a business cares about is how much data would be lost if this database failed right now, and what would you have to do to get it back.
A date cannot tell you that. A database can have a full backup from an hour ago and still be unrecoverable to any useful point. We see four ways, again and again.
- A broken log chain. There is a gap between log sequence numbers, so every log backup taken after the break cannot be applied.
- A full backup written to
NUL. The job finished, msdb recorded it, and there is no file anywhere to restore from. - FULL recovery with no log backup, ever. The log cannot reuse its space and there is no point-in-time recovery. This is the most common real fault of the lot.
- Every full backup is
COPY_ONLY. Somebody took them by hand, so there is no differential base and no differential can be restored.
Each of these shows green on a last backup date column. That is why the cost is usually found the hard way, in the middle of an outage, with the business waiting.
Exposure: the honest number
The better measure is exposure. It is the amount of data at risk, counted in time. It climbs with every minute that passes and drops to zero at every backup that actually protects the data. Draw that against a week and you get a sawtooth, one lane per database.
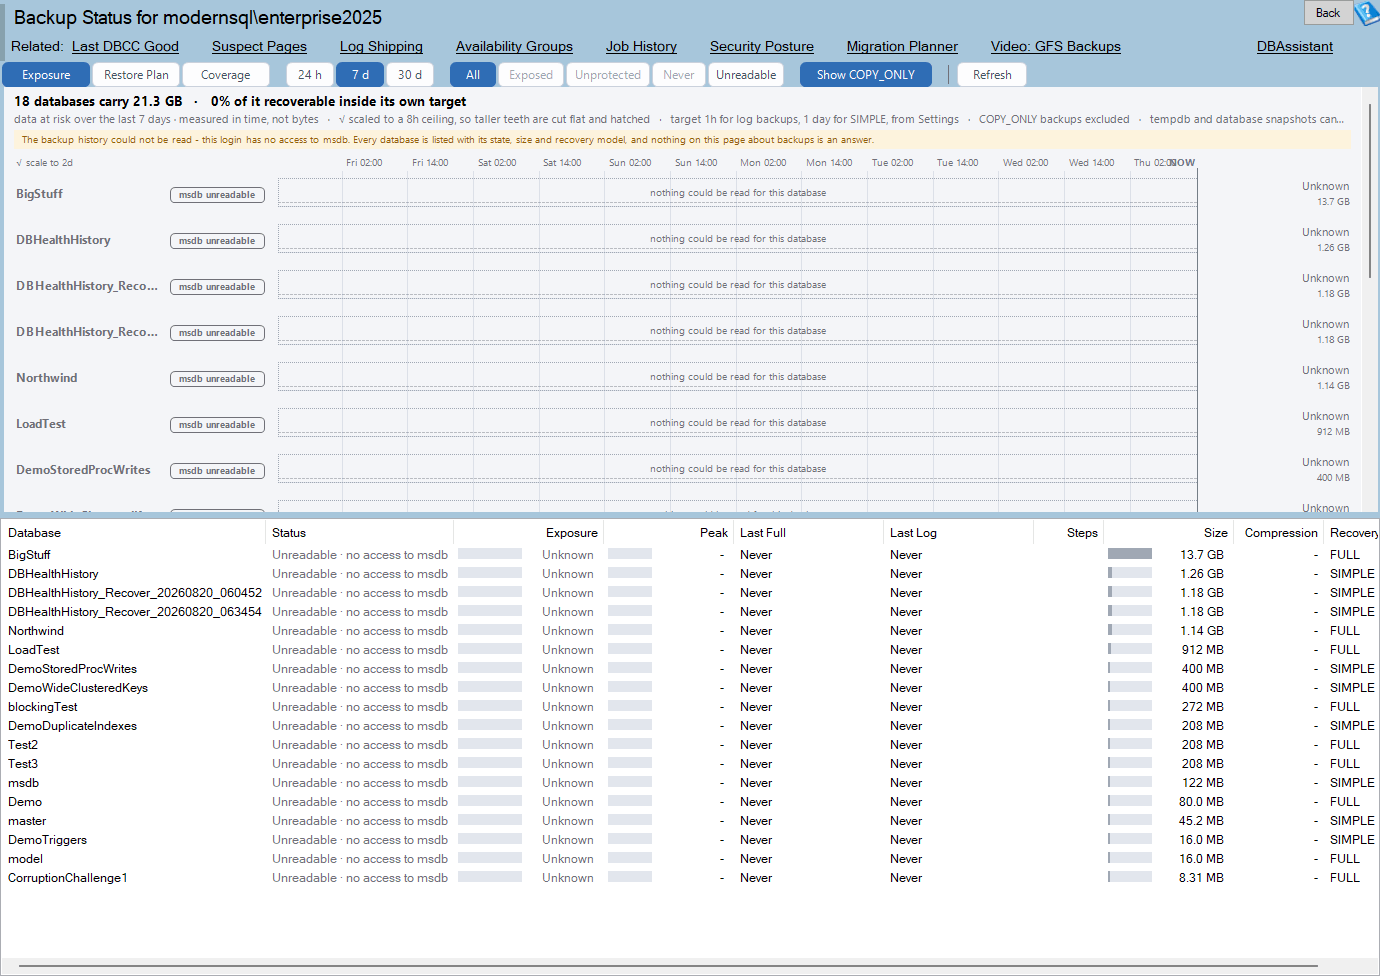
Backup Status is one of the reports in Database Health Monitor. It runs against your own servers, and it takes about a minute to have this same screen open on one of them.
Three things read straight off the picture. The peak of a lane is the worst data loss inside the window. The spacing of the teeth is your backup schedule, visible without opening SQL Agent. And the ramp still climbing at the right-hand edge is your exposure at this instant.
Exposure is measured in time and never in bytes. Converting it would need a log generation rate nobody sampled, and a made-up figure on a backup page is worse than none. Time is also the number you agreed with the business in the first place.
The clock starts at the newest recovery point. That is the latest of the last full, the last differential and, for databases that are not SIMPLE, the last log backup. A backup written to NUL never counts.
Each database is judged against its own target
One number for a whole instance does not work. A SIMPLE database cannot have a log backup at all, so holding it to a sixty minute target would turn the page red and teach you to stop looking. The report applies two targets instead.
| Recovery model | Judged against | Default |
|---|---|---|
FULL and BULK_LOGGED | Log backup target, the most data you can lose | 60 minutes |
SIMPLE | The full backup cycle | 1 day |
Three settings on the Thresholds tab control this: how fresh a full backup must be, when it counts as overdue, and the log target. If the overdue value is not larger than the fresh one, the report quietly uses fresh plus one day. The log target is held between one minute and seven days.
Exposure then falls into bands, each measured against that target. Within target is Protected. Up to twice the target is Watch. Up to eight times is Exposed, and beyond that is Unprotected. Two grays sit apart from the red ramp: Never backed up, drawn hatched, and Unknown, drawn hollow. They are a different answer, not a worse one.
The four faults from earlier override all of this. Any one of them forces a database to Unprotected however recent its last backup was. A full backup older than the overdue setting forces it to at least Exposed, because a perfect log cycle sitting on a two month old full is not protection.
Reading SQL Server backup status in five minutes
Start with the amber notice band. If msdb could not be read, nothing else on the page is an answer. In that case every database still lists with its state, size and recovery model, but every backup fact is blank, and the page says so plainly.
Next, read the summary line. It gives the database count, the total size, the worst exposure, and the share of your bytes that is recoverable inside its own target. That share is weighted by bytes rather than rows, which matters more than it sounds.
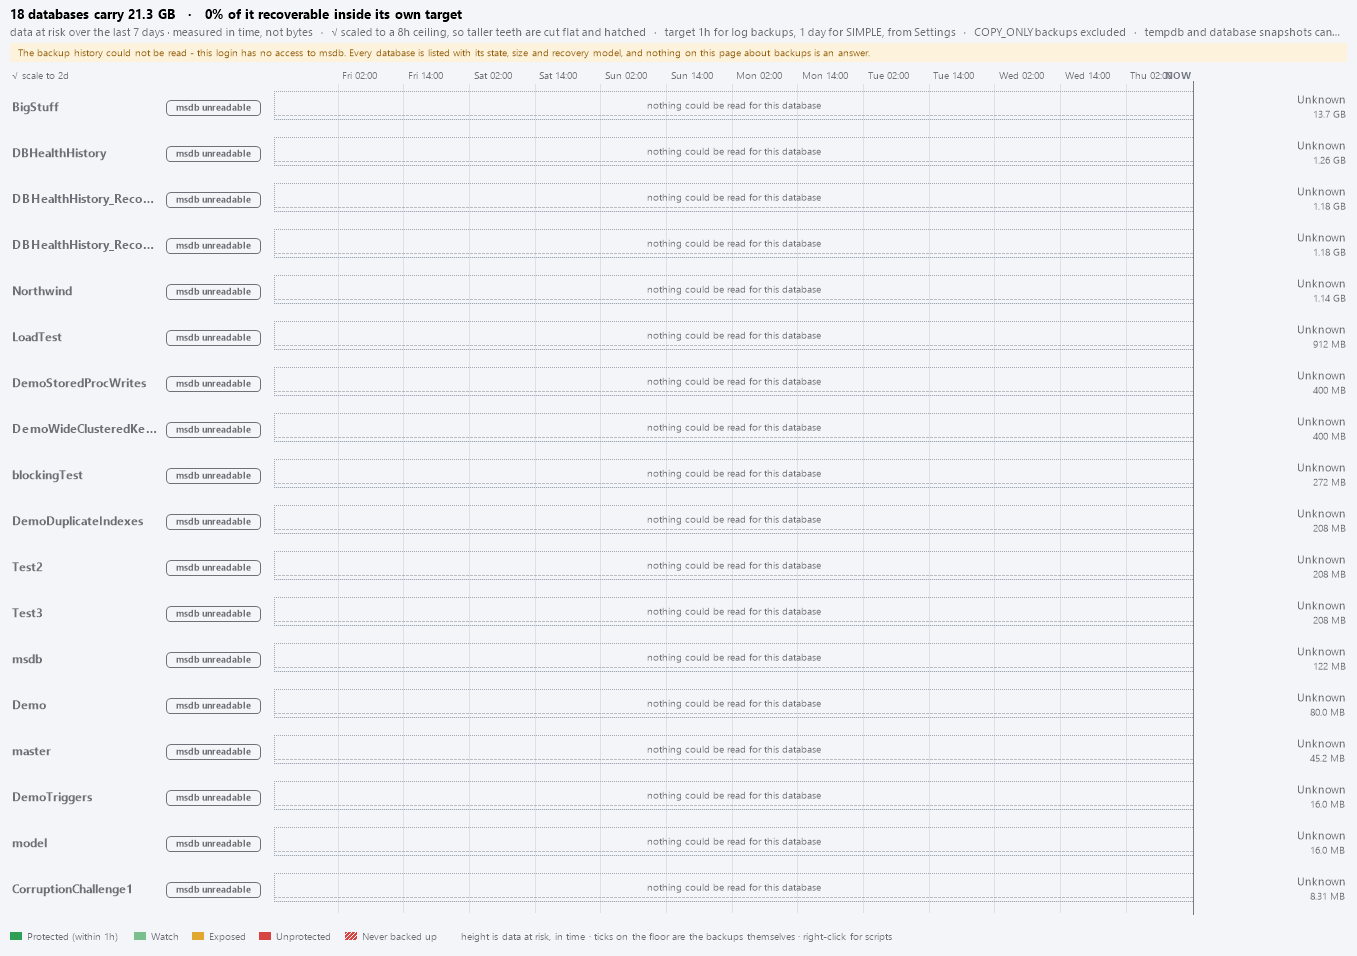
Then look at the lanes. Even teeth mean the schedule is running. A lane whose teeth stop partway across and turn into one long ramp tells you the backup schedule died at that point, and the horizontal axis tells you when. A dashed line across every lane is your target, so a number in a dialog becomes something you can picture a tooth staying under.
Ticks on the floor of each lane are the backups themselves. A filled square is a full, a narrow bar is a differential and a hairline is a log backup. A red square is a full that was damaged or went to NUL, and a struck-through square is a COPY_ONLY full. A chain break appears as a dashed vertical line labeled with a cross.
The grid sits below. Rows are ordered by urgency, not by name: never backed up first, then Unprotected, Exposed, Watch, Protected and finally Unknown. Within a band the largest exposure wins. The first row is always the worst thing on the instance.

Read the Status column, not the dates. A recent Last Full next to Unprotected · written to the null device is the whole reason this report exists. Then compare Exposure with Peak. Low exposure with a high peak means something went wrong earlier in the window and then recovered. That is worth knowing before it happens again.
Row counts lie, so check coverage and the restore plan
Three tiny databases unprotected and one 4 TB database unprotected are the same number of rows and very different problems. The Coverage view weighs the answer by allocated size, as one stacked bar with a segment per band. Clicking a segment filters the page to that band, which is the only way to isolate Protected or Watch. It is also the view you take to management.
The Restore Plan view redraws the same lanes as the restore you would actually run: a block for the full, one for the differential if it applies, a hatched run for log backups, and any unprotected gap marked separately. A restore that takes 400 files is a different conversation from one that takes 3. Chain continuity here comes from the first and last LSN values, not from missing timestamps, because a gap in the schedule is not the same as a gap in the chain.
Switching between Exposure, Restore Plan and Coverage never goes back to the server. Changing the window to 24 hours, 7 days or 30 days does, as does toggling COPY_ONLY. With that toggle on, hand-taken copies are removed entirely, so they neither lower the curve nor count as protection. That is usually what you want.
What the report refuses to hide
Some of the best decisions in this report are about what it keeps on the page. Read-only databases stay, because a database nobody can back up is exactly the row you want to see. Offline and restoring databases stay too, drawn hollow and banded Unknown rather than dropped. A brand-new database with no backup is noted as new instead of accused.
What it leaves out is tempdb and database snapshots, since neither can be backed up and a permanent red row there is noise dressed as a finding. The system databases master, model and msdb get no exemption.
Some limits are worth knowing. msdb is joined by database name, not id, so a database dropped and recreated under the same name inherits the old history. Always On secondaries get no special handling: a readable one is judged against its own local msdb, which lacks the backups taken on the primary, so check those rows on the primary. And the last full, differential and log figures cover all recorded history, not only the window.
One more honest note. If a snapshot tool or third party product protects a database without writing to backupset, or msdb was rebuilt, the page cannot know. It says so in the notice band, and that is the one thing to check before acting. The full reference lives in the Backup Status documentation.
What to do with the answer
Every right-click item copies T-SQL to the clipboard and runs nothing. Taking a backup is a decision about where the file goes and how long it will take, and that does not belong on a status page. What you get is a full backup script with CHECKSUM and a RESTORE VERIFYONLY, a differential and log script when they apply, and a query for the whole msdb history of that database.
Two items deserve particular attention. The restore sequence is built from what msdb recorded, with every file named and a MOVE for each database file, ending at the newest backup that is not COPY_ONLY. Read it for your most important database. If you would not want to run it, you have found something. The header also warns that msdb records where a backup was written, not whether the file is still there.
The second is the script for a database in FULL recovery that has never had a log backup. You can either schedule log backups or switch to SIMPLE, and the generated script spells out what that costs you. A whole-instance log backup job script is there as well, ready for SQL Agent.
Backup problems rarely announce themselves. They leave a trail in places like the error log, a habit we cover in Reading the SQL Server Error Log Before It Reads You. If the report shows the schedule stopped, Job History is the next place to ask why. If you suspect corruption, check the last good DBCC result too, because a backup of a corrupt database is a corrupt backup.
The cost of this exercise is small: a few minutes reading a page. The cost of skipping it is learning your real recovery point during an outage. We would rather you learned it on a quiet Tuesday.
What to check on your own server
- Open the report and read the amber notice band before anything else
- Check the Status column of the first grid row, not the Last Full date
- Compare Exposure with Peak on every lane that matters to you
- Copy the restore sequence for your most important database and read every step
- Set the log backup target to the most data you can honestly lose
Try Database Health Monitor Today
Backup Status shows how much data each database would lose if it failed right now, and catches the faults a last backup date reports as healthy. Database Health Monitor shows it on every instance you connect, in the time it takes to open the report.
Download Database Health Monitor and run the Backup Status report against your own server. There is nothing to configure first, and you will know inside a few minutes whether it tells you something you did not already know.