A report that finishes in two seconds on Tuesday takes eleven on Monday morning, run by the same person with the same parameters typed into the same screen. Nothing about the query changed. The plan behind it did, quietly, the way SQL Server changes plans on its own, and the question every DBA eventually asks is why is one execution plan slower than another when nothing else on the server moved.
Why is one execution plan slower than another for the same query in SQL Server? Why is one execution plan slower than another? Because it is doing measurably more work somewhere Query Store tracks per execution, logical reads, tempdb use, memory grant or waiting, not because it is inherently worse. Comparing those numbers, alongside rows returned, shows which one changed and rules out plans that are simply waiting in line.
The instinct is to pull up the two plans, compare how long each one ran on average, and call the slower one broken. Duration is the symptom, though, not the diagnosis. Two plans for the same statement can post very different times for reasons that have nothing to do with which one is written better. One may simply have been handed a different parameter and a different amount of work to do. Another may have run at exactly the moment something else on the box was holding it up. Database Health Monitor's Plan Resource Profile report exists to tell those cases apart instead of leaving you to force a plan and hope.
Query Store has been recording the numbers that separate them the whole time: CPU time, logical reads, physical reads, memory granted, tempdb used, log bytes written, and how long each plan spent waiting, all kept per plan and per execution for as long as the history window covers. The report pulls every one of those measures together for a single statement and draws its plans against each other, so instead of guessing at what changed underneath the query, you can see it.
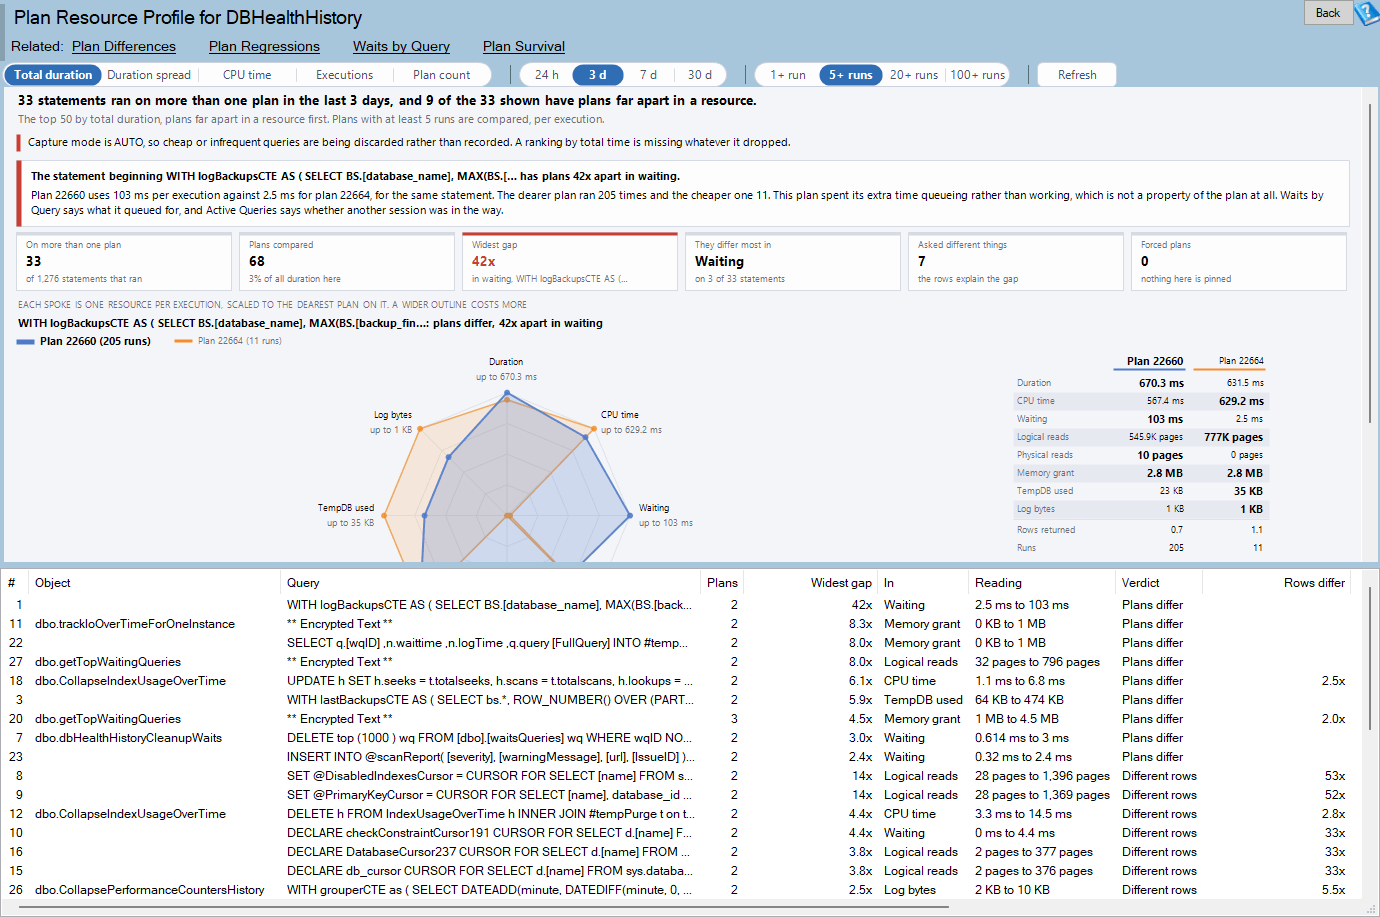
Plan Resource Profile is one of the reports in Database Health Monitor. It runs against your own servers, and it takes about a minute to have this same screen open on one of them.
In this post
- Why is one execution plan slower than another?
- Reading the radar chart
- The grid: which statement to open first
- What it takes to run this report
- Why small gaps don't count
- What to do with the answer
Why is one execution plan slower than another?
Before the report calls one plan worse, it checks what each plan was actually asked to do. Rows returned is tracked for every plan and kept separate from the eight resource measures on purpose: a plan that read ten times as many pages but also returned ten times as many rows was not handed a harder job by the optimizer, it was handed a different parameter. Forcing the cheaper plan back on in that case would just pin one caller's workload onto everyone else's. Once rows returned is ruled out, each statement lands in one of four readings.
| Verdict | What it tells you |
|---|---|
| Plans differ | The plans are far apart on a resource other than duration, and the rows returned do not explain it. A real plan fault. |
| Different rows | The plans are far apart, but the rows each one returned are too. That is a parameter problem, not a plan problem. |
| Same work | Duration is far apart and nothing else is. The slower runs were waiting in line, not doing more work. |
| Settled | Nothing is far enough apart to matter. More than one plan for a statement is normal and not worth chasing. |
Reading the radar chart
Pick a statement in the grid and its plans appear as outlines on a radar, one spoke per resource, up to six plans at a time, with the busiest drawn heaviest. Each spoke runs from nothing at the center to the worst plan on that measure at the rim, so two outlines sitting on top of each other mean two plans that cost about the same, and one outline pushed out along a single spoke is the finding worth chasing. Read the shape, not the area. The spokes multiply eight unrelated units together, so a bigger-looking outline is not automatically a more expensive plan; only the individual spokes mean anything.
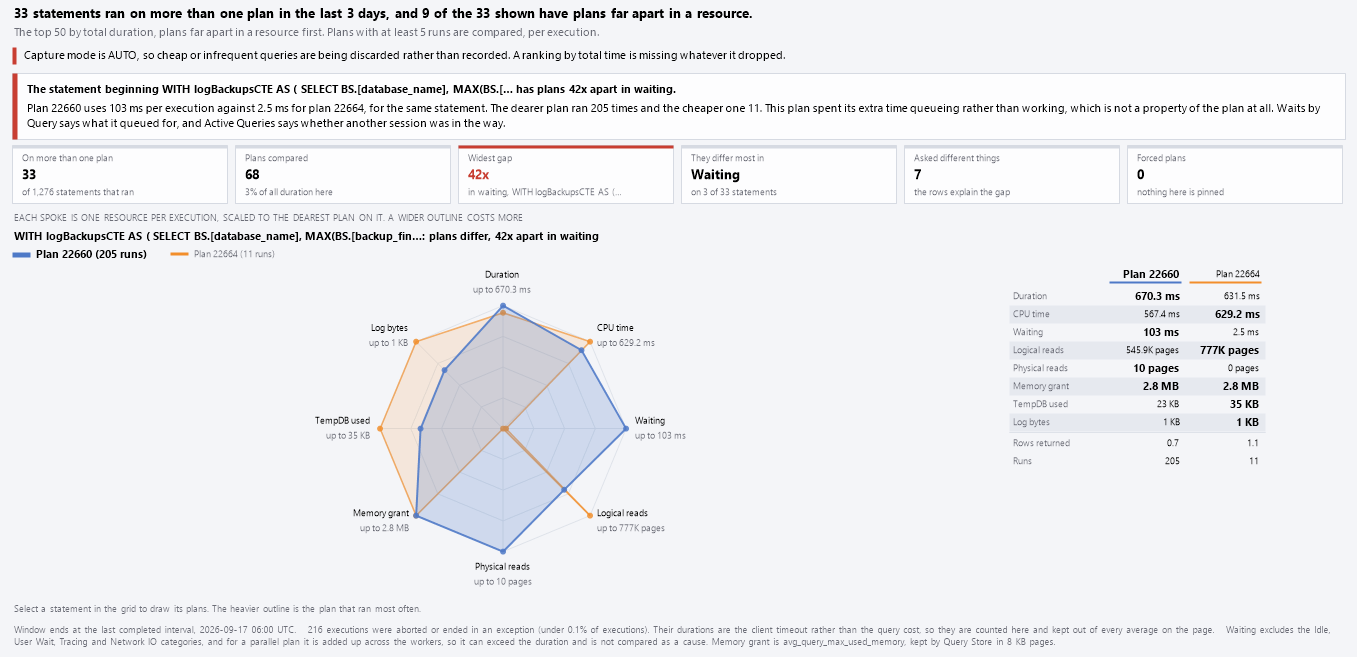
- A wide gap on logical reads with CPU time close together usually means a seek turned into a scan.
- A wide gap on tempdb alone usually means a sort or a hash spilled that its sibling never needed.
- A wide gap on waiting with every other spoke settled is contention, not a plan problem.
- A memory grant of zero beside a real number is not missing data, it is a plan with no sort, hash or parallel operator to pay for.
The grid: which statement to open first
Below the chart, the grid ranks every statement with more than one plan: Plans differ first, then Same work, then Different rows, then Settled, widest gap first within each group. That ordering alone does most of the triage, because the plan faults worth investigating are already at the top, ahead of the parameter sensitivity and the noise underneath them. Each row carries the object the statement belongs to when it has one, the best and worst plan's average duration per run, total executions and duration across the compared plans, and whether any of them has already been forced.

- Explain these plans lays out every plan on all eight measures side by side, in words.
- Go to Plan Differences shows which operators actually changed between the plans.
- Go to SQL Server Waits by Query: Find What's Actually Slow follows a Same work verdict to what the plan was actually waiting on, rather than to which operator to blame.
- Go to Parameter Sensitive Plans follows a Different rows verdict to the parameter behind it.
- Go to Plan Regressions is where a plan actually gets forced, once you've confirmed it deserves to be.
What it takes to run this report
The report needs SQL Server 2017 or newer, because the per-plan wait statistics and the tempdb and log columns it reads all arrived that year; on 2016 the page explains why instead of loading.
| Requirement | Why it matters |
|---|---|
| SQL Server 2017 or newer | +sys.query_store_wait_stats+ and the per-plan tempdb and log columns were not tracked before this version. |
| Query Store on for the database | That is where every plan's execution history lives. |
| +WAIT_STATS_CAPTURE_MODE+ on | Without it the waiting spoke has nothing to draw. |
| +VIEW DATABASE STATE+ permission | Needed to read the Query Store catalog views at all. |
Why small gaps don't count
Not every difference is a finding. A plan that reads 259 pages against a sibling's 13,180 is a real gap; a plan that reads 105 pages against a sibling's 100 is rounding. The report sets a floor for each measure, in whatever unit that measure is naturally counted in, and only calls two plans apart once the larger reading clears it. Below the floor, one plan quietly used almost nothing of a resource, and the ratio between them would not mean anything.
- Duration, CPU time or waiting: 1 millisecond
- Logical reads: 100 pages
- Physical reads: 10 pages
- Memory grant: 16 pages
- Tempdb used: 10 pages
- Log bytes: 4 KB
There is one wrinkle worth knowing before trusting the waiting spoke on its own. A parallel plan spreads its work across several workers, and Query Store adds up what every one of them waited on. A scan that finishes in 58 milliseconds across eight workers can log well over 400 milliseconds of waiting, several times its own clock time. The report still draws that number, because it is a real one, but it does not treat waiting as the cause of the gap by itself; something else, like the reads, usually explains it better.
What to do with the answer
A Plans differ verdict is worth a trip to Plan Differences to see which operator actually changed, and from there to Plan Regressions if the older plan deserves to be forced back on. A Different rows verdict means the fix is not a plan at all, it is understanding why one caller's parameter is so much more expensive, which is a question for Parameter Sensitive Plans. A Same work verdict is the cheapest to resolve and the easiest to get wrong: nothing about the plan needs to change, and forcing one only guarantees the next run waits on the exact same thing.
The full reference for Plan Resource Profile covers every column in the grid, every message the page shows when Query Store or wait capture is off, and the readings this piece only touched on. The report does the sorting; deciding what forcing a plan will and won't fix is still a judgment call, just a much better informed one.
What to check on your own server
- Check whether Query Store is turned on and WAIT_STATS_CAPTURE_MODE is set to ON for the database
- Open the report for a database with at least a week of history and note the statements marked Plans differ
- Right-click a Plans differ row and choose Explain these plans to see all eight measures side by side
- Raise the execution floor from 5+ to 20+ runs and see which findings survive
- Follow a Same work verdict to Waits by Query instead of forcing a plan
Try Database Health Monitor Today
This report shows whether a slower execution plan is doing more work, running into contention, or was simply handed a different parameter, instead of leaving you to guess from duration alone. Database Health Monitor shows it on every instance you connect, in the time it takes to open the report.
Download Database Health Monitor and run the Plan Resource Profile report against your own server. There is nothing to configure first, and you will know inside a few minutes whether it tells you something you did not already know.