
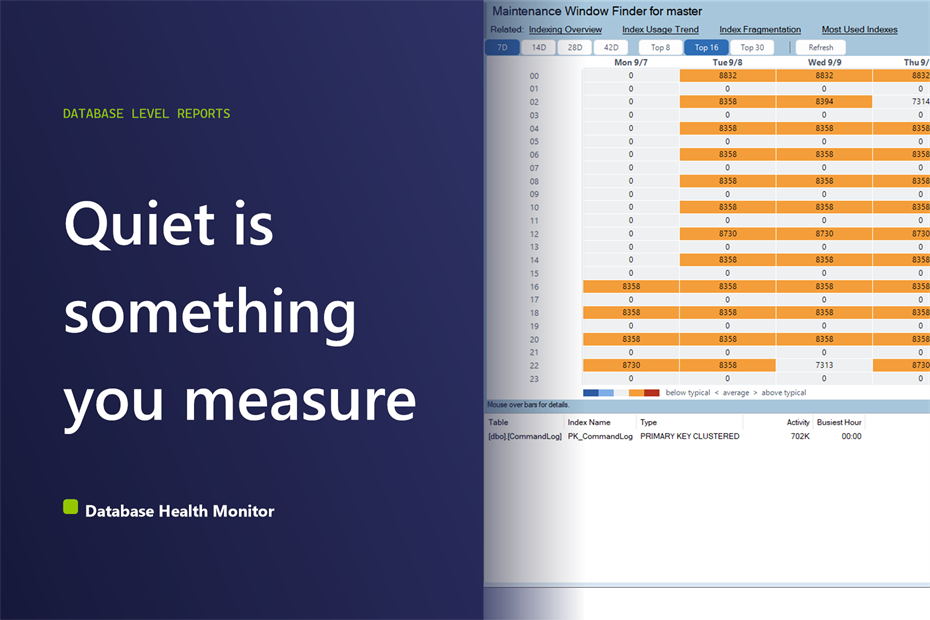
Across client servers we keep finding the same thing. An index rebuild job is set for a slot such as 2 a.m., because somebody once decided that was quiet. Nobody went back to check. Then the job runs long, collides with a nightly load, and the morning brings the complaints. Your SQL Server maintenance window is probably a habit, not a measurement.
How do I find the best SQL Server maintenance window for rebuilding indexes? The best SQL Server maintenance window is a measured one. Group index reads and writes by hour of day across several weeks of collected history, then look for a cool block that repeats on many days. Cross-check it against the specific index you plan to rebuild, because a batch table can peak when the database is quiet.
Database Health Monitor has a report built to end the guessing. It is called Maintenance Window Finder, and it works from data the collector was already writing. Every row in IndexUsageOverTime carries a timestamp. This is the first report to group that timestamp by hour of day, which turns a pile of stored history into a picture of when your database is busy and when it is not.
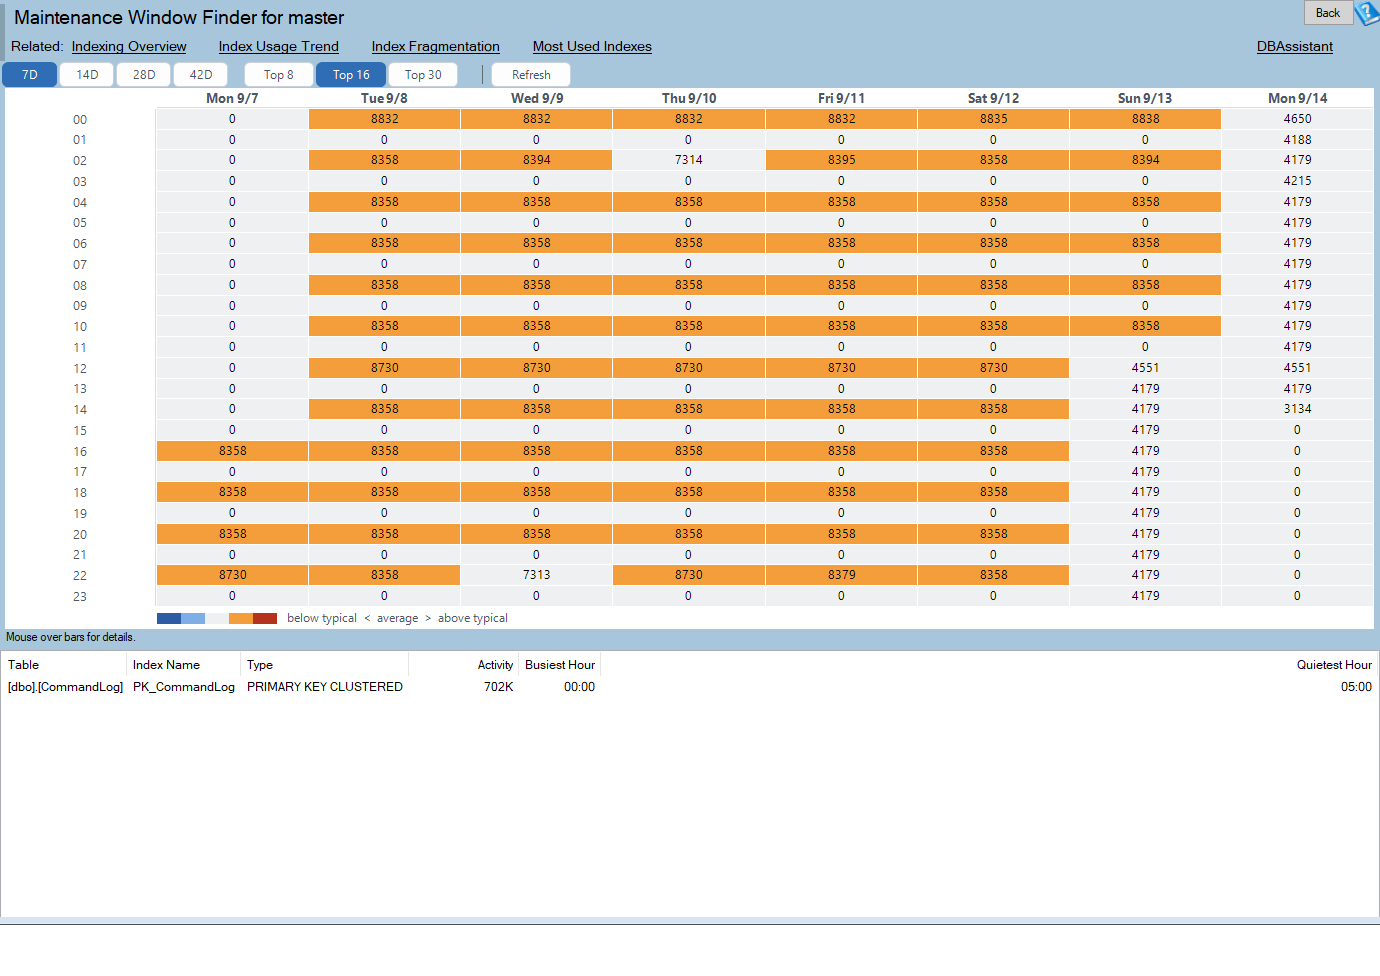
Maintenance Window Finder is one of the reports in Database Health Monitor. It runs against your own servers, and it takes about a minute to have this same screen open on one of them.
Why the schedule in your head misleads you
The first thing most teams reach for is a feeling. Nights are quiet, weekends are quieter, so rebuilds go overnight. The second is one look at one bad night, or a single graph of the whole database. Both mislead, in different ways.
One quiet night proves little. A lone quiet stretch is often a fluke, and one unusually quiet week can look like a pattern that a full month never confirms. A window only counts if it repeats.
The database wide view has its own trap. A reporting index that is busy all business day and a batch index that is busy only overnight can carry the same total activity. They want opposite windows. Add them together and the difference disappears. The database looks calm at night while the one index you are about to rebuild sits in the middle of its load.
Measuring your SQL Server maintenance window by the hour
The report draws a heat map. Each column is one calendar day, each row is one hour of day, and each cell holds the combined reads and writes for that hour. Hover a cell for the exact count. It is printed in the cell as well.
The color is the clever part. A cell is not shaded by its distance from zero. It is shaded by how far that hour sits from the typical hour on the sheet, hot when busier, cool when quieter. Index activity follows a hard power law, so a handful of hours carry most of the traffic. Anchor the scale at zero and the whole sheet looks uniformly warm. Measuring from typical is what pulls a busy hour apart from a quiet one.
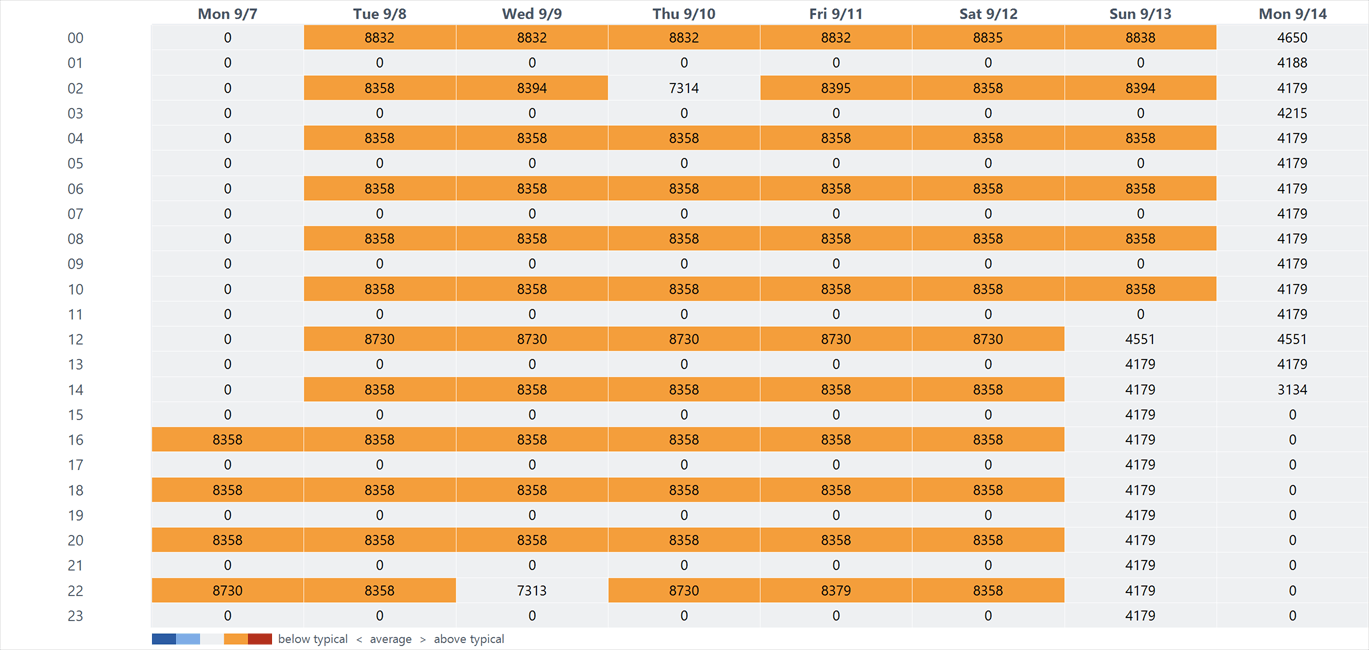
What you are hunting for is columns of cool cells that repeat across several days. That is a real recurring quiet stretch. A single cool cell surrounded by busy ones is not.
Beneath the heat map sits a grid for the narrower question. Each row is an index, with its table, name, type and total activity, plus a Busiest Hour and a Quietest Hour. Those two are worked out across all twenty-four hours for that index alone, ignoring which day a reading landed on. The grid is ranked by activity, so the indexes carrying real load come first.
The toolbar sets the time frame to 7D, 14D, 28D or 42D, and the grid length to Top 8, Top 16 or Top 30. Seven days is the default and forty-two is the ceiling. One requirement: the picture only exists across collected history, so without the historic collection database the page says so instead of drawing an empty chart.
What to do with the answer
- Find the coolest recurring block on the heat map. That is your candidate window, checked against the whole database.
- Cross-check it against Busiest Hour and Quietest Hour for the specific index you plan to rebuild.
- Confirm with a longer time frame before you trust a short one.
- Treat a zero cell as nothing recorded, not as a guarantee.
That last step matters. IndexUsageOverTime stores only nonzero deltas, so an hour the collector never reached and an hour that was truly silent look identical, both drawn as zero. The page's own subtitle says so. It is a limit, not a defect, and it means the report proposes a window while you still decide.
| What you see | What it usually means |
|---|---|
| A clear overnight trough on every day of the window | Schedule around it with more confidence than one quiet night would earn. |
| No quiet hour at all, on a database read around the clock | There is no free window to find, only a least-bad one. |
| One index quiet all day and busy all night | Likely a batch or ETL table. Its Quietest Hour can sit inside the database's busiest block. |
A window is only half of the plan. You also need to know what deserves the time inside it, and our post SQL Server Index Fragmentation: Stop Chasing the Percent covers that side. The report's neighbors help too: Index Usage Trend shows whether an index is growing or fading, and Most Used Indexes confirms one is worth scheduling around at all. The full column reference lives in the Maintenance Window Finder documentation.
What to check on your own server
- Write down the hour your rebuild jobs start today and note who chose it, and why
- Group the index reads and writes you already collect by hour of day across several weeks, not one night
- Look for cool blocks that repeat across many days and ignore any single quiet hour
- Check the index you are about to rebuild for its own busiest and quietest hour, separately from the whole database
- Treat an hour with no recorded activity as unknown until you know the collector was running
Try Database Health Monitor Today
It replaces a guessed rebuild schedule with a day by hour map of when each index is actually busy and when it is quiet. Database Health Monitor shows it on every instance you connect, in the time it takes to open the report.
Download Database Health Monitor and run the Maintenance Window Finder report against your own server. There is nothing to configure first, and you will know inside a few minutes whether it tells you something you did not already know.
Related reading: Is This Index Still Used? Read the Trend, Not the Total. Covers how to tell whether an index is still being read by charting its reads over time, so an index that has quietly gone silent shows up long before its lifetime total does.
Related reading: Who Gets SQL Server Email? Nobody Can Tell You. A look at how to find every address your SQL Server actually mails, including leavers, dead mailboxes and script-chosen recipients that no operator dialog shows.