
Every SQL Server problem eventually turns into the same set of questions from the business. When did this start? Who changed it? Will it happen again? How long until we run out of room? Database Health Monitor version 4.1869 is built around those questions. It adds 33 new reports that answer them from the history the monitoring collector has been saving, along with printing and PDF output for every page, high availability and SQL Agent job history that outlives msdb, and 973 fixes.
This post is written for the people who are accountable for SQL Server but do not live in it every day: IT managers, operations leads, application owners and the owner of a small business whose systems depend on a database. It explains what version 4.1869 changes in business terms and where each change saves time or reduces risk.
The problem with the last known good answer
Most monitoring shows you what is happening right now. That is useful during an outage, but outages are the exception. The rest of the year the questions are about trends and evidence. Is the server getting busier? Is last night’s slowdown a one off? Did the deployment on Tuesday make things worse? Without a record, every one of those answers is a guess, and guesses turn into long meetings.
Database Health Monitor has kept that record for some time in its history database. Version 4.1869 is the release where we put it to work. The new reports read the history and turn it into plain findings: a ranked list, a date, a name, a chart. Each report also shows where the history starts and where the collector was not running, so a gap in the data is never mistaken for good news.
A page you can hand to your manager or your auditor
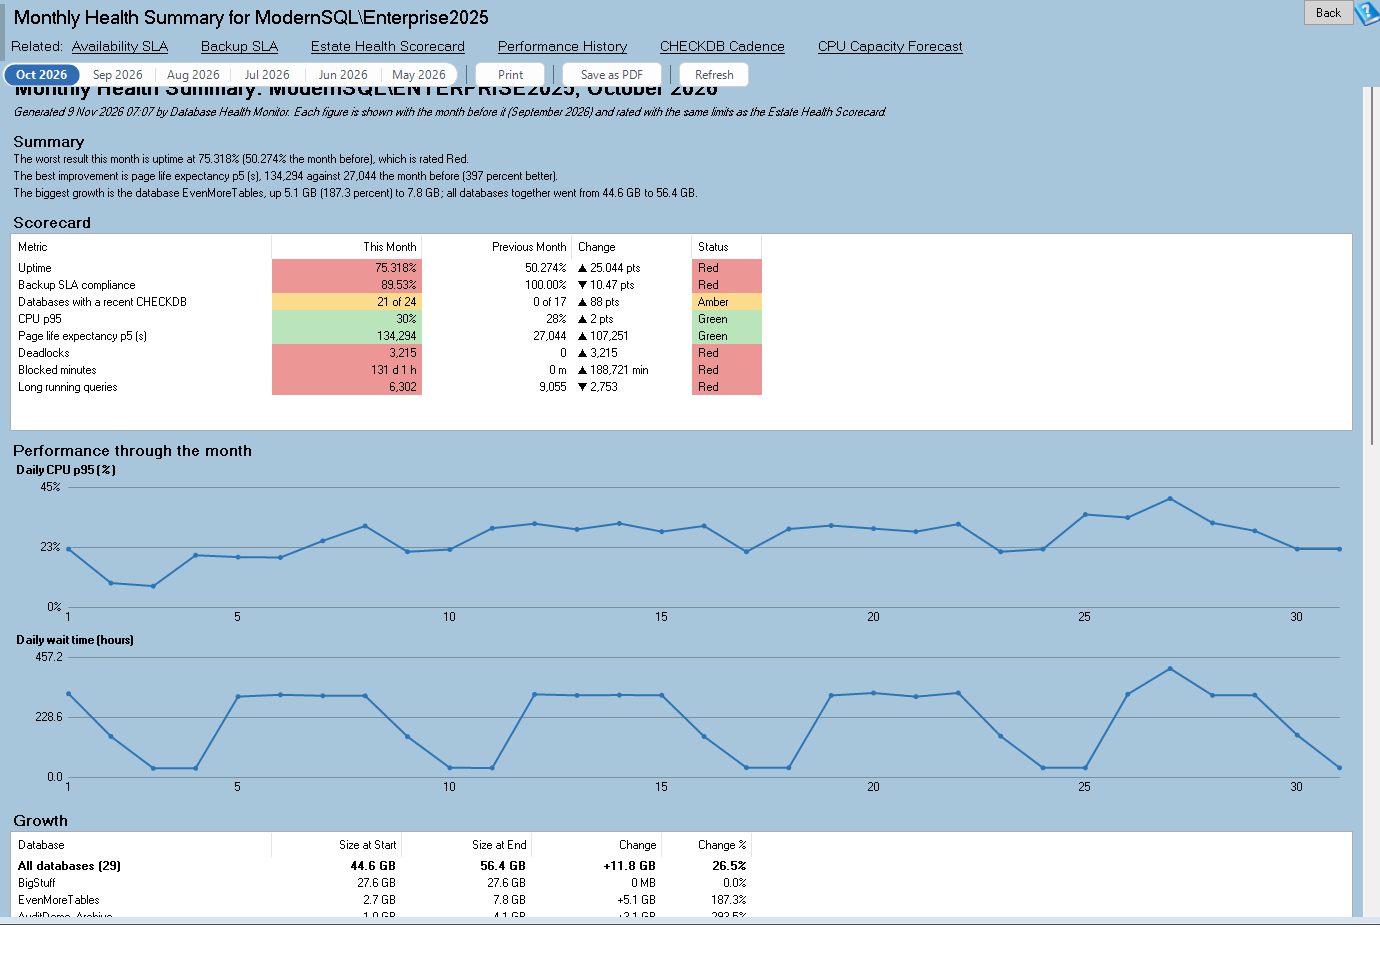
The report that will matter most to managers is Monthly Health Summary. It produces one printable page per SQL Server instance per month covering uptime, backups, CHECKDB, growth and peaks. That is the page that answers “how are the databases doing?” without anyone needing to open a tool.
It works because version 4.1869 also adds printing and PDF output across the product. Ctrl+P prints the page you are looking at, Ctrl+Shift+P saves it as a PDF, and every grid and chart menu gains its own print and PDF items. Printouts are drawn in light colors on white whatever the screen theme, and a historic time window is written into the header so a page says which period it covers. A report that goes into a monthly packet, an audit binder or a ticket is now one keystroke away.
Estate Health Scorecard complements it for teams with several servers. It puts every monitored instance side by side, week by week, for CPU, waits, page life expectancy, connections and blocking, so the one that is drifting is visible without opening each server in turn.
Knowing the monitoring itself can be trusted
A monitoring tool that silently stops collecting is worse than no tool, because it produces a calm picture of a system nobody is watching. Monitoring Coverage is the report that guards against that. It shows which collectors ran, where each history table has gaps, any collector errors, and how the resolution of the data drops as it ages. For a manager it is a simple assurance: the evidence behind every other report is complete, or here is exactly where it is not.
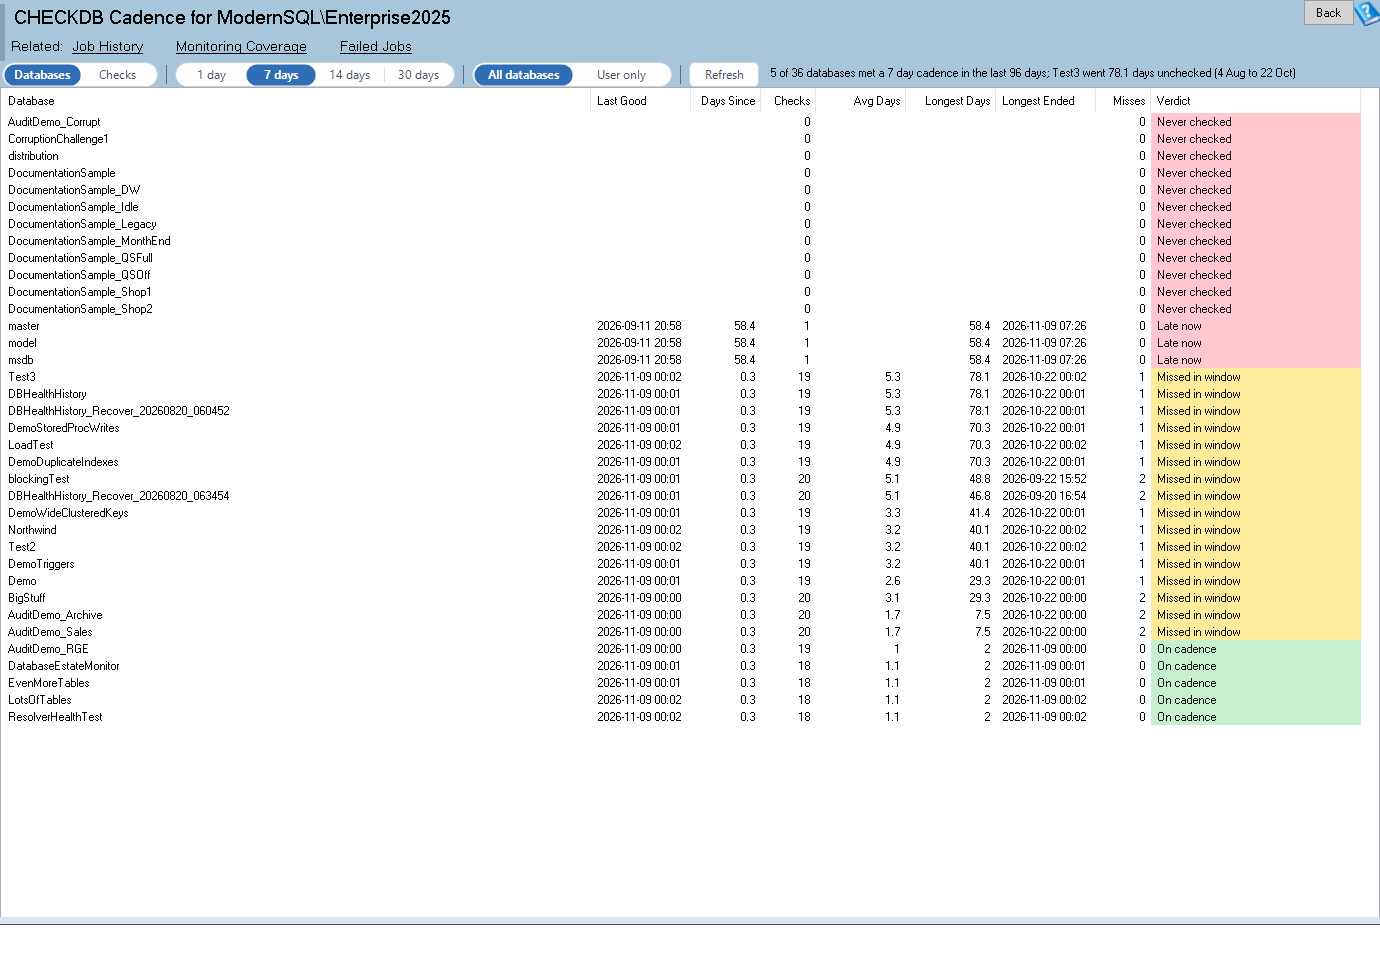
CHECKDB Cadence deserves a mention in the same breath, because it addresses one of the quieter risks. A database that has not had a clean integrity check for weeks may be carrying corruption nobody knows about. The report shows how often each database really got a clean check, the longest unchecked stretch and every miss. It is built from history, so a success last night does not hide six weeks of nothing before it.
Finding out who and what, not just that something happened
Several of the new reports exist to attach a name to a problem so the right person can fix it.
Blocking Culprits ranks the sessions that held others up over 30 days, by the number of sessions affected and the seconds they were held. Instead of “the application was slow on Thursday” the conversation becomes “this process held up that many sessions for this long.”
Schema Change Analytics shows who changes what, finds deployments in the DDL log, and highlights out of hours changes and their impact. For any organization that cares about change control, it is a way to see what really changed, not only what was ticketed.
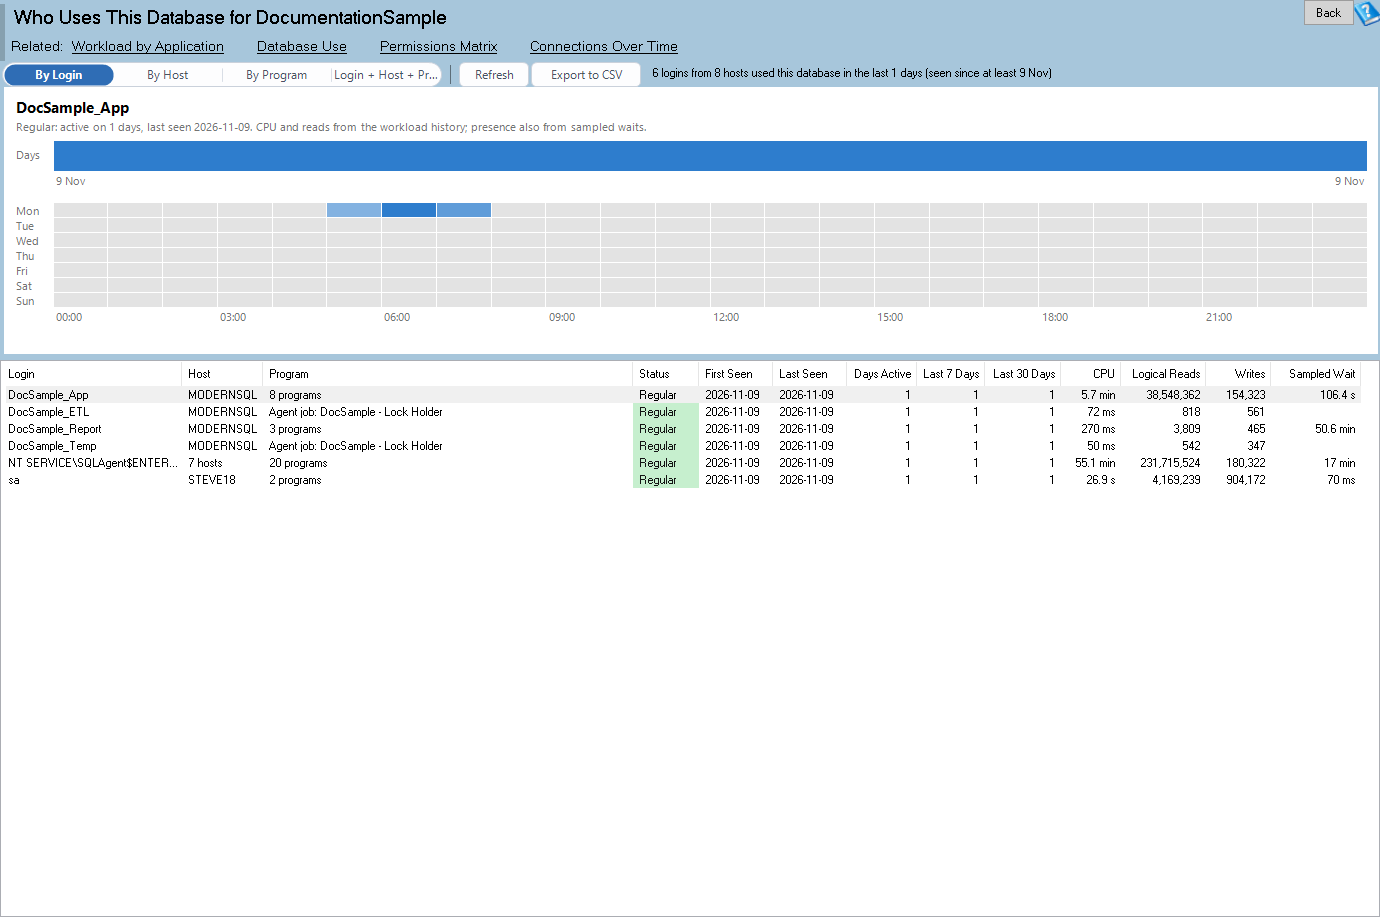
Who Uses This Database lists the logins, hosts and programs seen over time, the newcomers, the ones that have gone quiet and the days each was active. Dormant Logins and Applications turns the same history into a cleanup list of logins, hosts and programs not seen working for months. That is useful for security reviews, license conversations and any project that retires an old application.
Planning instead of reacting
The most expensive SQL Server problems are the ones that arrive as a surprise: the drive that fills on a Friday night, the CPU that runs out of headroom at month end. Four of the new reports turn those surprises into dates.
Database Space Runway looks at free space inside the data files, the growth of the tables, the next autogrowth and the date the drive fills. CPU Capacity Forecast takes the peak hour CPU trend by month and projects the date the busiest hour reaches the limit. Storage Saturation Curve plots disk latency against I/O load for each drive, so you can tell whether a slowdown is the workload or the storage. File Latency Trend shows read and write latency for each database file by day for 90 days and flags the regressions.
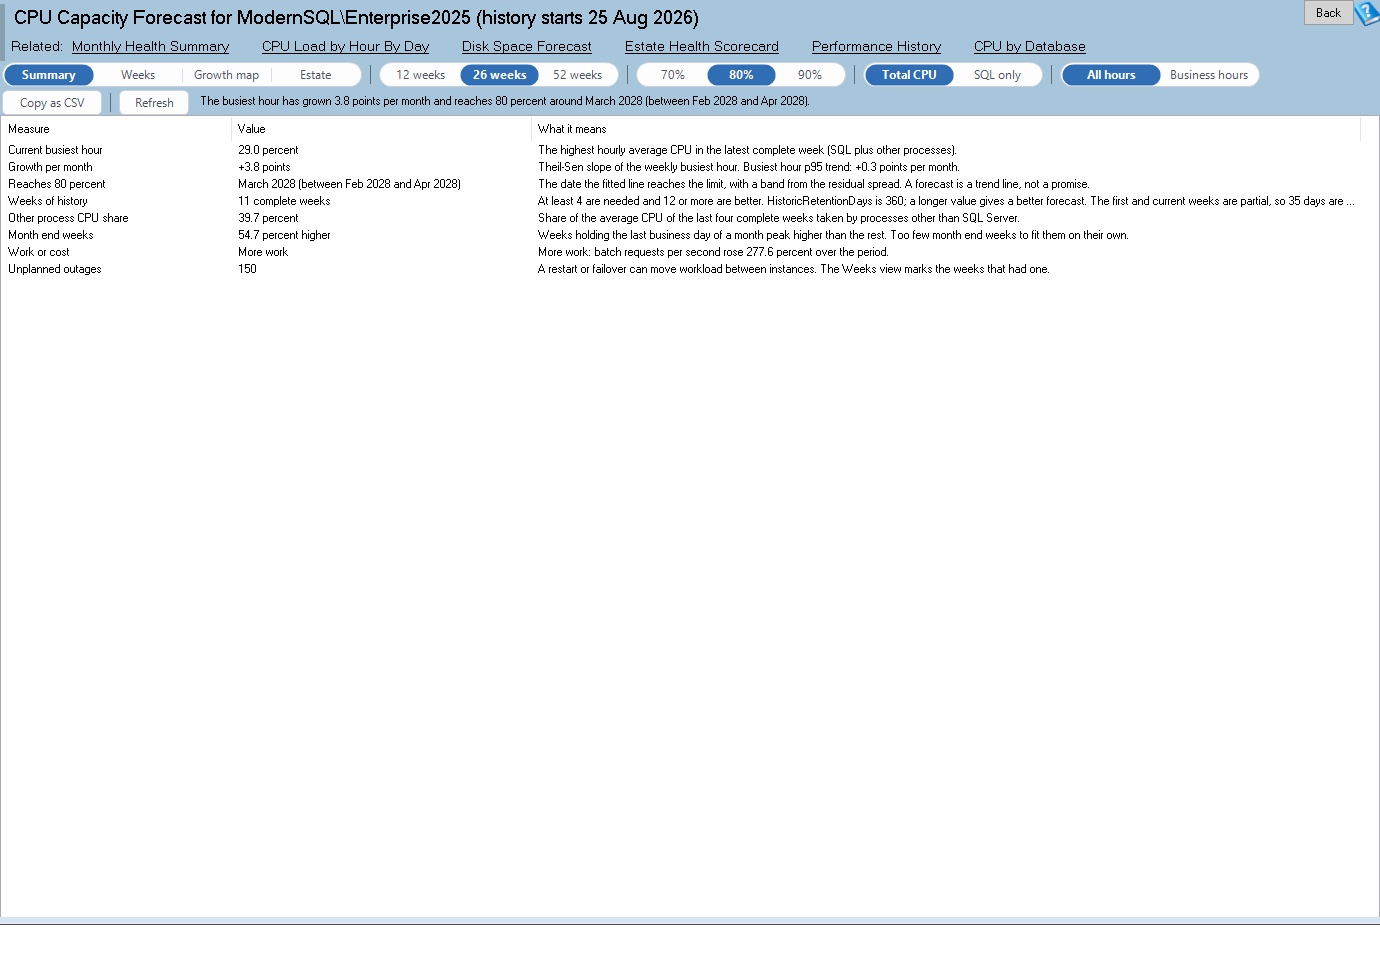
A forecast with a date on it changes how budget conversations go. Asking for more storage or more cores is easier when the request comes with a chart and a projected date than when it comes with a feeling.
Restart Recovery Profile adds a number that matters for maintenance planning. After each restart or failover it measures how long page life expectancy, CPU, compiles and waits took to settle back to normal. If the server takes an hour to feel normal after a patch, the maintenance window plan should say so.
Cost and cleanup
Some of the new reports find things you are paying for and not using. Cold Data Finder lists large tables that are rarely read, sized against their activity, as candidates for archiving or compression. Index Adoption and Abandonment lists new indexes that never got used and indexes that were used and then stopped. Table Shrink and Purge Watch finds tables that lose rows, purge jobs that stopped running, and space that was never given back. Database Activity Calendar names the databases with no activity at all, which are the first candidates to review when you are trimming licensing or server count.
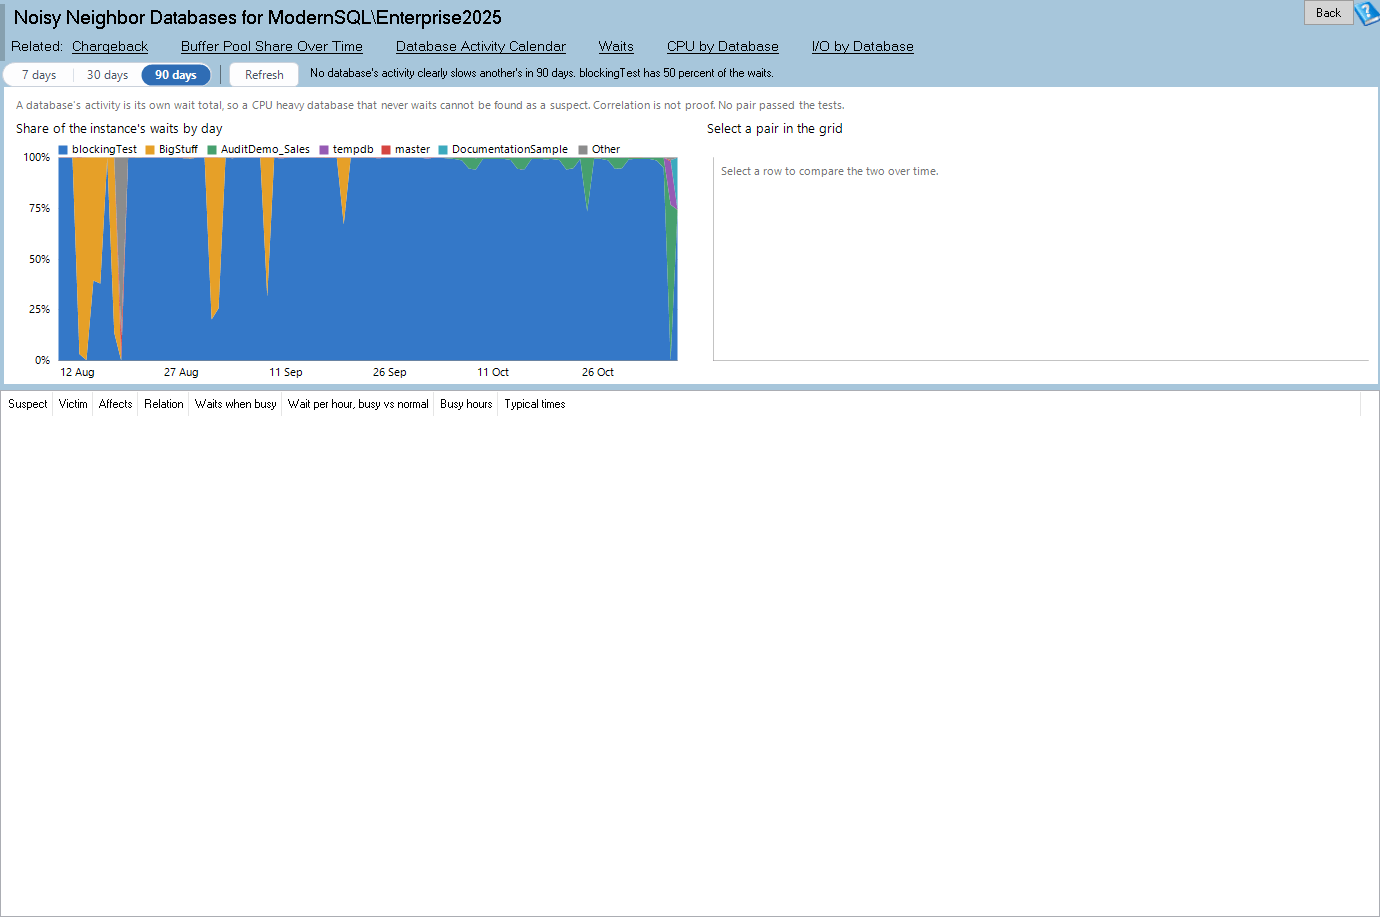
Noisy Neighbor Databases helps with a different cost: the cost of one badly behaved database slowing down the others on a shared instance. It shows each database’s share of the instance waits by day and which database’s spikes line up with slowdowns in the rest, so the conversation about moving or fixing a database starts with evidence.
Jobs, backups and the things that run at night
SQL Agent jobs are the quiet machinery of most SQL Server systems: backups, index maintenance, imports, reports. When one slows down or stops, nobody notices until a morning report is wrong. Version 4.1869 adds several tools for them.
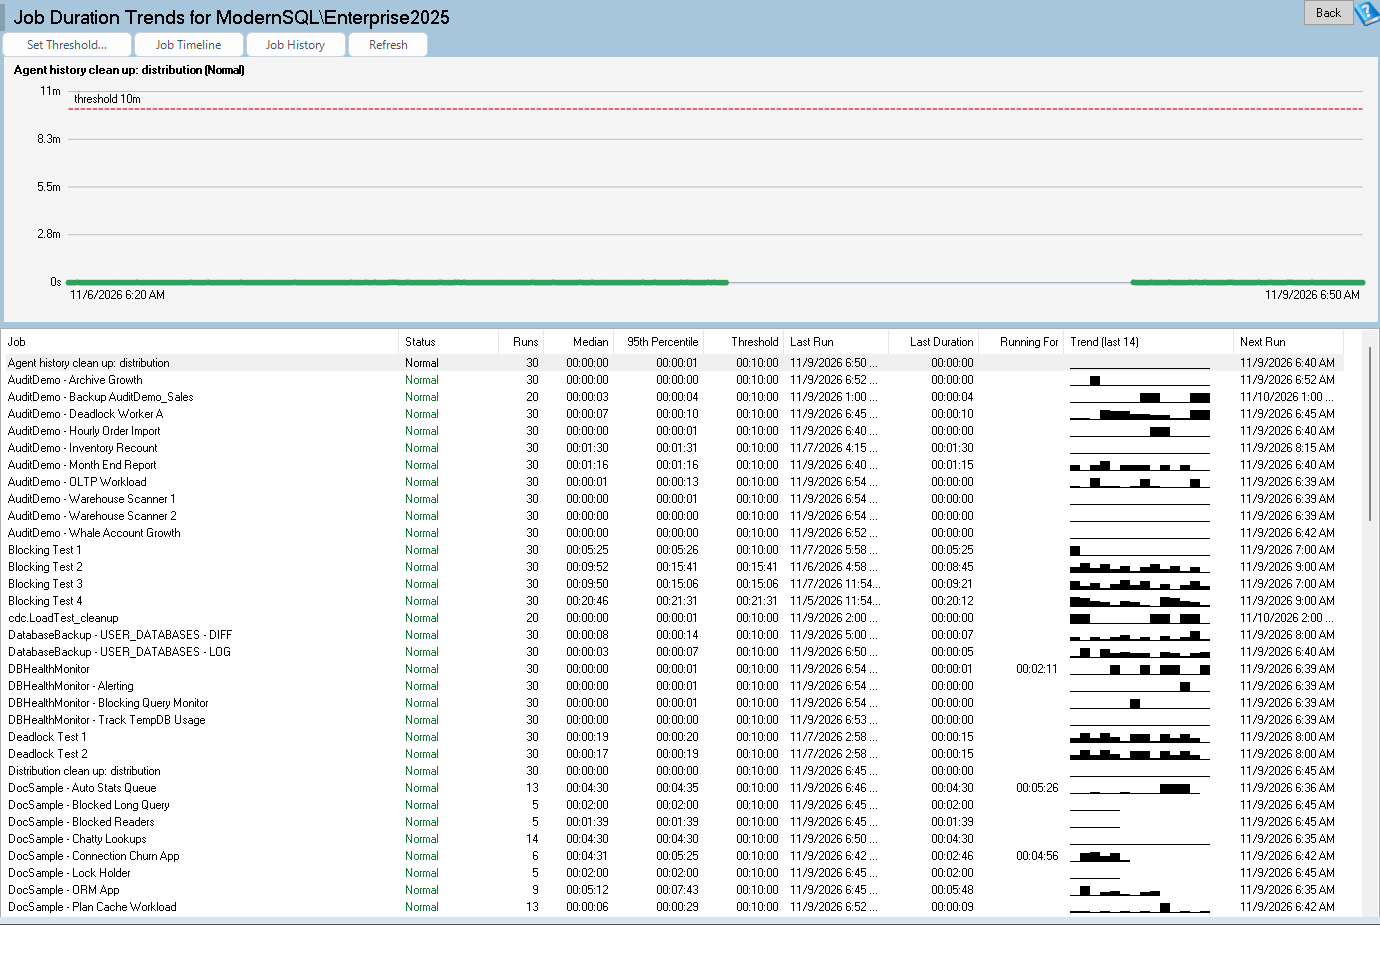
The history database now keeps job runs past msdb’s own retention, with a baseline for each job and a threshold dialog for deciding what counts as unusual. A new alert, 5023, fires for a job that has stopped running when it should have run, which is the failure a duration threshold can never catch. Job Duration Trends shows each job’s run durations over time with the unusually long runs picked out. Job Timeline draws a cross server timeline of job runs so overlaps are visible. Agent Job Resource Cost reports the CPU, reads and writes each job uses per run and per day.
High availability, with a record
If your business depends on an Availability Group, log shipping or replication, the question that matters is how much data you could lose and how long recovery would take. Version 4.1869 begins keeping a history of exactly that. The collector samples Availability Group RPO and RTO, failovers, log shipping latency and replication latency, and the new HA/DR History report draws them over time with the events marked.
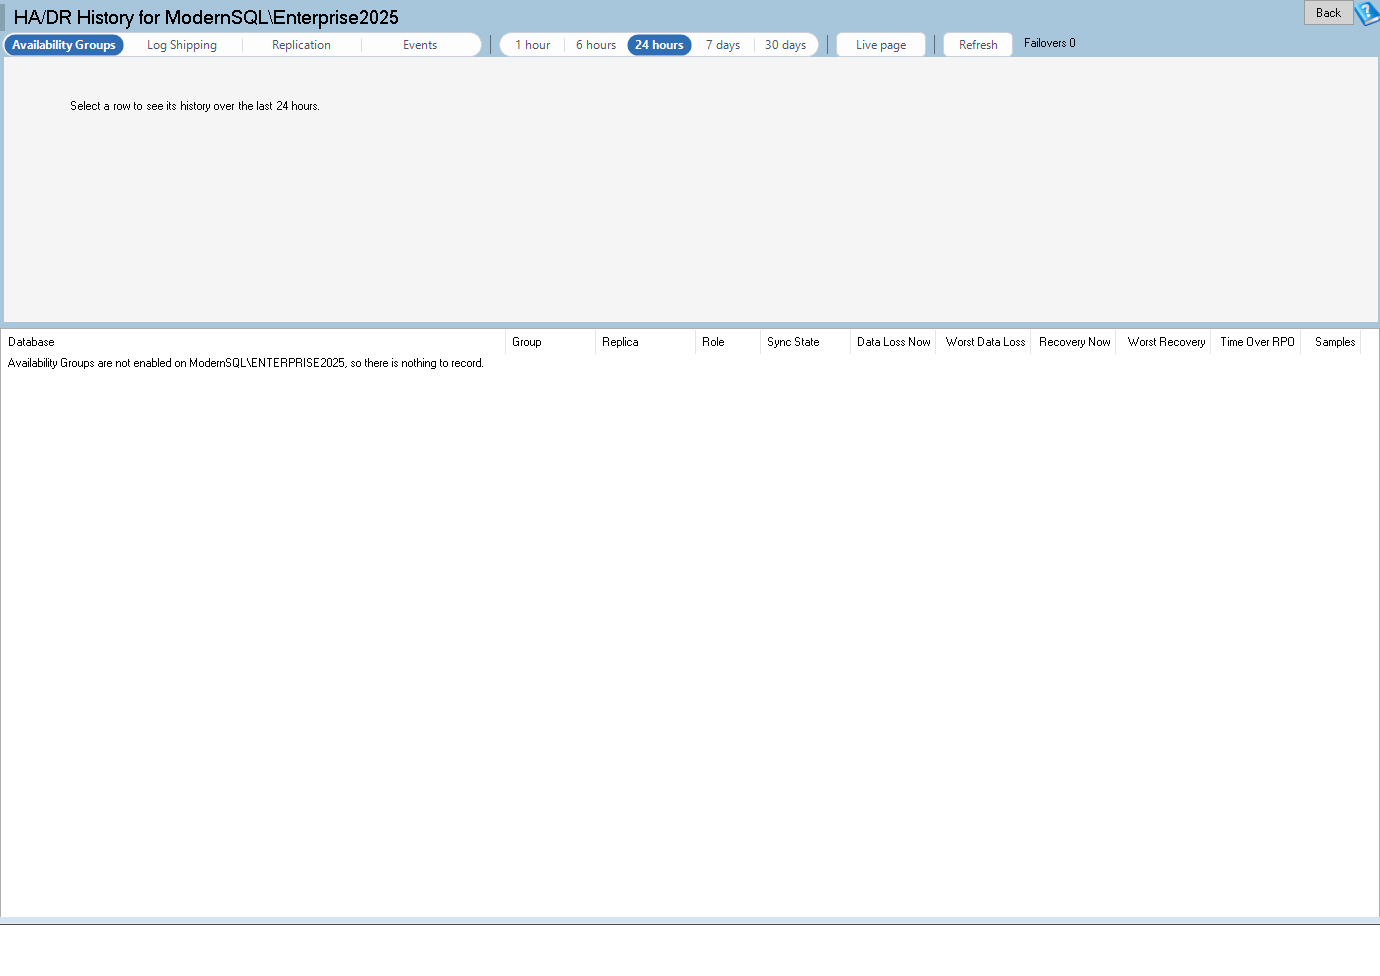
Four new alerts accompany it: 5031 for Availability Group data loss exposure, 5032 for a group that is not healthy or has failed over, 5033 for log shipping that is behind and 5034 for replication latency. Those are the conditions that turn a recovery plan into a recovery problem, and now someone is told when they begin.
Dashboards for the wall and for the meeting
Custom Dashboards, introduced in version 4.1818, grow considerably in this release. Another 15 instance reports get tiles that show the report’s own headline, and a new family of Database page tiles covers backups, files, indexes, statistics and Query Store health for a chosen database. Tiles pick a sensible size, color blind mode is honored, and a click opens the report on the item you pointed at.
For teams with many servers, the work underneath matters as much. Refreshes cancel abandoned queries, pause while minimized and load off screen tiles as you scroll. Live tiles share one pooled connection per server per poll, and estate tiles scale to 50 or more servers without false “did not answer” rows. Copy link on a published board opens it for a teammate with the same range and server, and a built in board can be copied and customized in one step. A board prints through the same print and PDF feature as everything else, which means the picture on the wall can also be the page in the meeting packet.
Better help and a steadier product
Every new report has a help page, and there are new pages for Printing and Saving as PDF, Connection Problems, Patch Currency, Pop Out Windows and the Monitoring Service and Tray Application. The new reports and more than 25 existing reports have real screenshots captured from a sample database, so you can see what a report looks like before you open it.
The release also contains 973 bug fixes across Database Health Monitor, Azure SQL Health Monitor, Schema Drift, Data Compare, Query Loading Ramp, the monitoring service and the tray application, including 15 crash reports. Much of that came from reviewing the new reports and tiles line by line before they shipped, and from checking grids at a common laptop resolution so that columns are on screen rather than hidden off the edge.
A month with the new reports, as a thought exercise
To make this concrete, picture an ordinary month for a company with a handful of SQL Server instances and no full time database administrator. This is a thought exercise, not a customer story, but every step uses a report that ships in version 4.1869.
In the first week, the person responsible opens Monitoring Coverage and confirms that every instance has been collected without gaps. That takes a minute and it sets the tone for everything else: the numbers can be trusted. Next comes Estate Health Scorecard, which shows the week’s CPU, waits, page life expectancy, connections and blocking for every instance on one screen. One instance looks different from the others, so the investigation starts there instead of everywhere.
In the second week the question is why that instance is different. Wait Anomaly Calendar shows which hours were outside the normal pattern for that database, and Long Running Query Trends shows which recurring statements are getting slower. Because the evidence is on the screen, the person can send the application owner a specific list of statements and times instead of a general complaint. The application owner can act on a list. They cannot act on a feeling.
In the third week the conversation turns to planning. Someone asks whether the server will cope with the new customer the sales team is about to sign. CPU Capacity Forecast and Database Space Runway give projected dates, and Storage Saturation Curve shows whether the disks have headroom. The answer comes with a chart attached, and the budget discussion is short.
In the fourth week the month closes. Monthly Health Summary is saved as a PDF for each instance and filed with the rest of the month’s records. If an auditor, an insurer or a new executive asks how the databases are managed, the answer is a folder of dated pages that show uptime, backups, CHECKDB, growth and peaks. Nobody had to assemble it by hand on the last day of the month.
None of that required a specialist to run a query. It required a tool that remembers what happened and presents it in a form that a non specialist can read and a specialist can verify.
Questions we hear from managers
Do I need to turn something on to get these reports?
Most of the new reports read the history database that the Database Health Monitor collector fills. If you already collect history, they work from the data you have, and each report shows where the history begins. If you have only just started collecting, the reports become more useful every day because there is more to compare. Open Monitoring Coverage first to see how much history exists.
Will the reports slow down my production servers?
The history reports read the history database, not the production databases, so opening them does not add load to the systems your business depends on. The live pages and the dashboards have their own safeguards: a timeout, a cache on live tiles, and one query per server at a time. In this release we also made dashboards cancel abandoned queries, pause while minimized and load tiles only as they scroll into view, specifically so that a wall of tiles does not become a source of load.
Can I show this to someone who does not use the tool?
Yes, and that is a major theme of this release. Printing and PDF output now works from every page, every grid and every chart, in light colors on white regardless of the screen theme. Monthly Health Summary is designed as a page for a reader who has never opened Database Health Monitor. Dashboards can be shared through the history database and a link opens the shared board with the same range and server.
What about Azure and non SQL Server platforms?
Database Health Monitor and Azure SQL Health Monitor are separate applications, and the fixes in this release include work in both. The new history reports described here are part of Database Health Monitor.
What does the version number mean?
The number after the 4 is the build number of the release, so 4.1869 is simply the 1869th build of the version 4 line. When you contact support, the version tells us exactly which reports and fixes you have, and the release notes that open after installation list everything in it.
Why a record matters more than a snapshot
It is worth ending the product discussion with the idea underneath it. A snapshot tells you the state of a system at one moment, and a record tells you how it got there. When a manager has to decide whether to spend money, accept a risk or change a process, the record is what turns a decision into something defensible. It shows the trend that justified the purchase, the change that preceded the outage and the check that was missed.
Many organizations discover the value of a record only after an incident, when the question is “what happened?” and the answer is gone because nobody was keeping it. Version 4.1869 is an attempt to make that answer available before the question is asked, in a form that people outside the database team can use.
What to do with it
If you already run Database Health Monitor, install version 4.1869, let the collector run, and open Monitoring Coverage to confirm the history is complete. Then try the three reports closest to the question your business asks most often: Monthly Health Summary for status, CPU Capacity Forecast and Database Space Runway for planning, or Blocking Culprits and Schema Change Analytics for accountability.
If you do not have anyone who can read these reports, or you would rather have an experienced SQL Server team interpret them, that is what Stedman Solutions does. Our Managed Services team uses Database Health Monitor every day, and the reports in this release are the ones we wished for during real engagements. Contact us through StedmanSolutions.com and we can talk about what your servers are telling you.