
Across many client servers we see the same pattern. CPU runs hot, but no single query is guilty. A handful of sessions sleep while holding locks. A statement that is instant in SSMS crawls when the application runs it. This is ORM SQL Server performance trouble, and it rarely shows up where people look first.
How do I find what is behind poor ORM SQL Server performance? Poor ORM SQL Server performance usually traces to a few framework habits: Unicode parameters that force implicit conversions on varchar columns, SERIALIZABLE transactions, chatty N+1 loops and open implicit transactions. Identify the framework behind each program from its plan cache fingerprints, then fix each habit in that framework's own settings.
Most teams start by sorting the plan cache by total CPU or duration. That finds statements. It does not find causes. The top of that list is often a cheap query called a million times, or a tidy query whose plan quietly converts a column on every row. Nothing on the list says which data access layer wrote the SQL, so nobody knows whom to ask. Database Health Monitor takes a different route: it works out the framework behind each connected program and scores what that framework is doing to the instance.
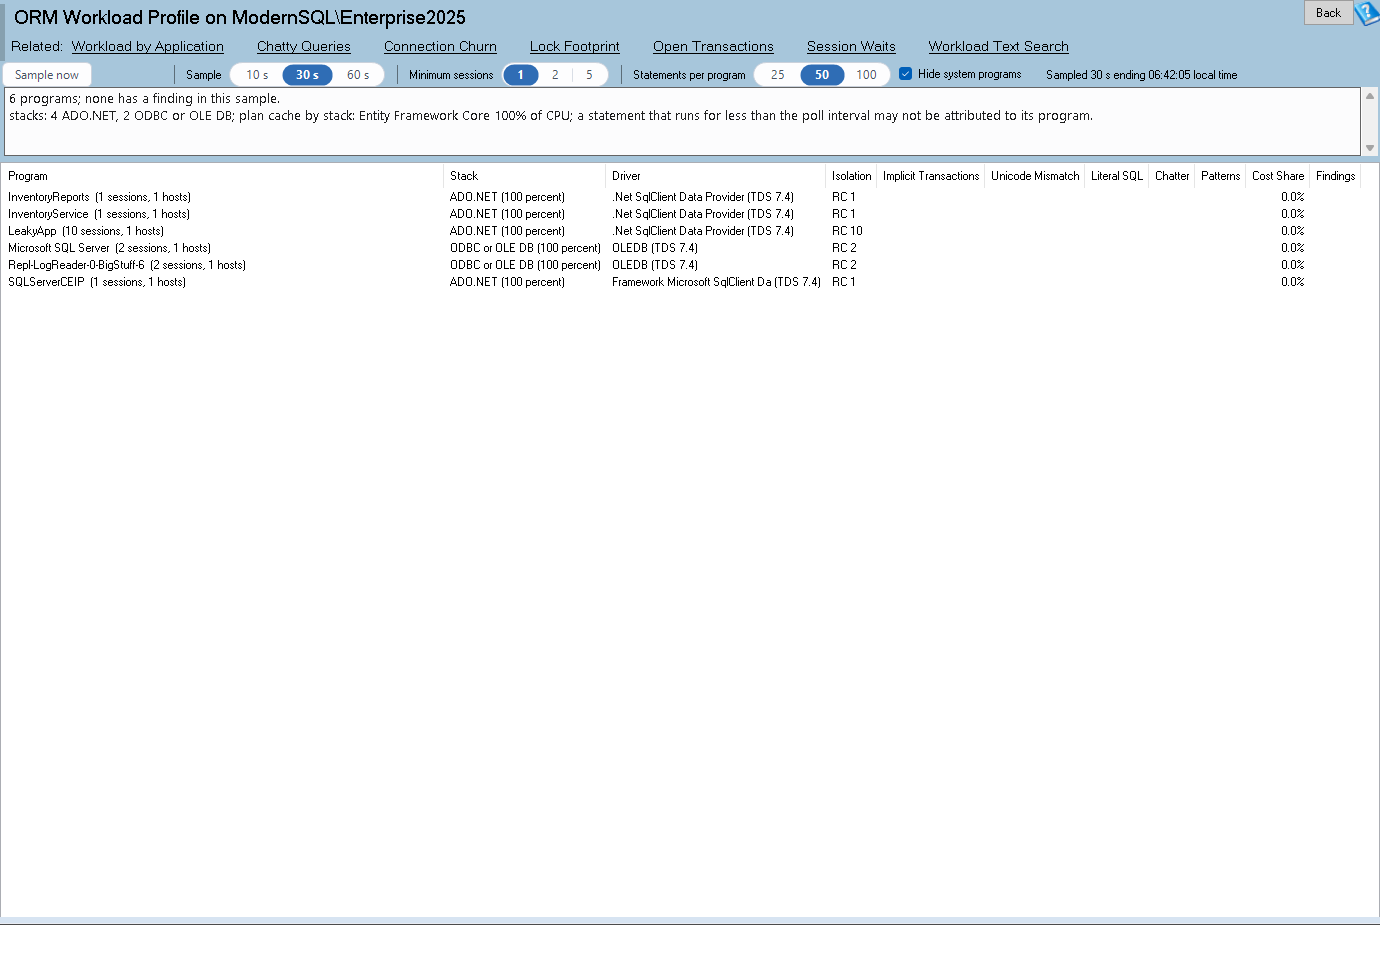
ORM Workload Profile is one of the reports in Database Health Monitor. It runs against your own servers, and it takes about a minute to have this same screen open on one of them.
Why ORM SQL Server performance hides in the plan cache
Frameworks leave fingerprints. Entity Framework 6 names derived tables Extent1 and Project1. EF Core aliases a table as [e] and names parameters like @__p_0. NHibernate and Hibernate alias a table customer0_. The Microsoft JDBC driver sends sp_prepexec with @P0. Dapper keeps the parameter names the developer wrote. Each batch votes, and the program takes the stack most batches agree on. Under 60 percent agreement, it is labeled Mixed and shows the two leaders.
The expensive habits are well known once you can see them. The worst is the one in the old Entity Framework complaint: every string goes to SQL Server as nvarchar(4000), your column is varchar, and the plan converts the column instead of the parameter. If that column is a seek key, the seek turns into a scan. The fix lives in the framework, so the DBA needs to say which one.
- Unicode parameters against varchar columns, High when the converted column is a seek key.
- SERIALIZABLE sessions, High when they hold key range locks. A .NET program with no explicit SET is the TransactionScope default.
- Implicit transactions left open over 60 seconds, High, and sleeping sessions with an open transaction, Medium.
- N+1 loops: statements under 5 ms of CPU called 100 or more times a minute, High at 1,000.
- A different plan than SSMS, from a .NET program with ARITHABORT OFF cached under more than one set of options.
What the report puts on screen
Pick a sample length of 10, 30 or 60 seconds and click Sample now. The report reads the plan cache counters, polls running requests once a second to learn which program runs which statement, then reads sessions, transactions, cursors and key range locks. It needs SQL Server 2008 or later and VIEW SERVER STATE. Open transaction counts need 2012. Management tools like SSMS and SQL Agent are hidden by default.
The grid has one row per program. You get the detected stack, the driver and protocol, sessions per isolation level, implicit transactions open, Unicode mismatches, the share of literal SQL and SET chatter, and the share of sampled CPU. Double-click a row and each finding appears with its evidence and its fix. If chatty commits are the suspicion, the WRITELOG Wait: Slow Storage or One-Row Commits? post covers the storage side of that coin. The ORM Workload Profile documentation has the full reference.
What to do with the answer
Right-click a program and copy the Markdown summary. That is the paragraph for the developers, and it speaks their language: a parameter type to change, an isolation level to set, a loop to batch. It is hard to argue with evidence that names their own framework.
Expect friction on SERIALIZABLE. Developers often have no idea their TransactionScope is doing it. Show them the key range locks. Then show them the sessions sleeping with an open transaction. That usually settles it.
The cost of skipping this is real. Teams add CPUs, buy storage and tune indexes for months while one parameter type does the damage. Ten minutes with a profile of the programs is cheaper, and it gives the developers something specific to fix.
What to check on your own server
- Sample the instance for 60 seconds during a busy period and note which programs carry the highest share of CPU
- Check each flagged program for nvarchar(4000) parameters converting varchar columns, and fix the parameter type in the framework
- Look for SERIALIZABLE sessions holding key range locks, and set an explicit isolation level in the .NET code
- Find implicit transactions open longer than 60 seconds and make the application commit or roll back promptly
- Hand the developers the Markdown summary for the program, with the evidence and fix for each finding
Try Database Health Monitor Today
The ORM Workload Profile names the framework behind each program and gives the developers a fix written in their own vocabulary. Database Health Monitor shows it on every instance you connect, in the time it takes to open the report.
Download Database Health Monitor and run the ORM Workload Profile report against your own server. There is nothing to configure first, and you will know inside a few minutes whether it tells you something you did not already know.