
Every shop we work with has a version of the same afternoon. A table is slow to write to, the storage bill has a line nobody can explain, and somebody asks the question that ought to be easy: is this index still used? Someone pulls up a usage report, sees a big read count, and leaves the index alone. The count is big because it is a lifetime total. The index may have gone quiet last month.
Is this index still used in SQL Server, and how can you tell without trusting a running total? Is this index still used? Only its reads over time can say. A running total hides the change, while a daily reads line per index shows steady, declining or stopped use weeks before the cumulative count reaches zero. Database Health Monitor's Index Usage Trend report draws that line from collected history.
Database Health Monitor answers that question with its Index Usage Trend report, which turns collected history into one small line per index. The rest of this post is about why the line is more honest than any total, and what to do once you have it.
Index Usage Trend is one of the reports in Database Health Monitor. It runs against your own servers, and it takes about a minute to have this same screen open on one of them.
Why a running total hides the change
Most usage reports add things up. That is natural, because sys.dm_db_index_usage_stats is itself a running total, and it resets every time the service restarts. A total answers how an index is doing overall. It cannot tell you whether that is still true.
Picture two indexes. One has carried a fifth of the database's reads for a full year. The other carried the same fifth until three weeks ago, then went silent. On Most Used Indexes they land in the same Critical bucket, because both reports only ever look at a total. The second index is the one you want to hear about, and the total will not mention it for a long time.
By the time that total has sunk far enough to show up on Unused Indexes, the history that would explain the silence has usually aged out of the collector's retention window. You are left deciding whether to drop something with the evidence already gone. We see this decision made on a guess more often than anyone likes to admit, and it is an expensive guess in both directions.
Is this index still used? Ask the line, not the total
The honest measure is reads per day, kept as a series and plotted across a window you choose. Shape shows what a total cannot: an index that fades, one that stops dead, one that only just woke up. The report compares average daily reads in the first half of the window with the second half. It does not lean on whichever day a row happened to arrive first or last.
It is also careful about missing days. If the collector recorded no reads for a day, the line breaks. It does not draw a straight stroke across the hole, because that fabricates a reading, and it does so exactly where an outage or a dropped collection job needs to be visible. A break is often the most useful thing on the card.
One limit is worth knowing up front. This is a historic-only report. There is no live mode, since a running total has no shape to plot. It needs the historic collection database, and when that is not configured the page says so and points you at Historic Settings instead of showing an empty chart.
What the report puts on screen
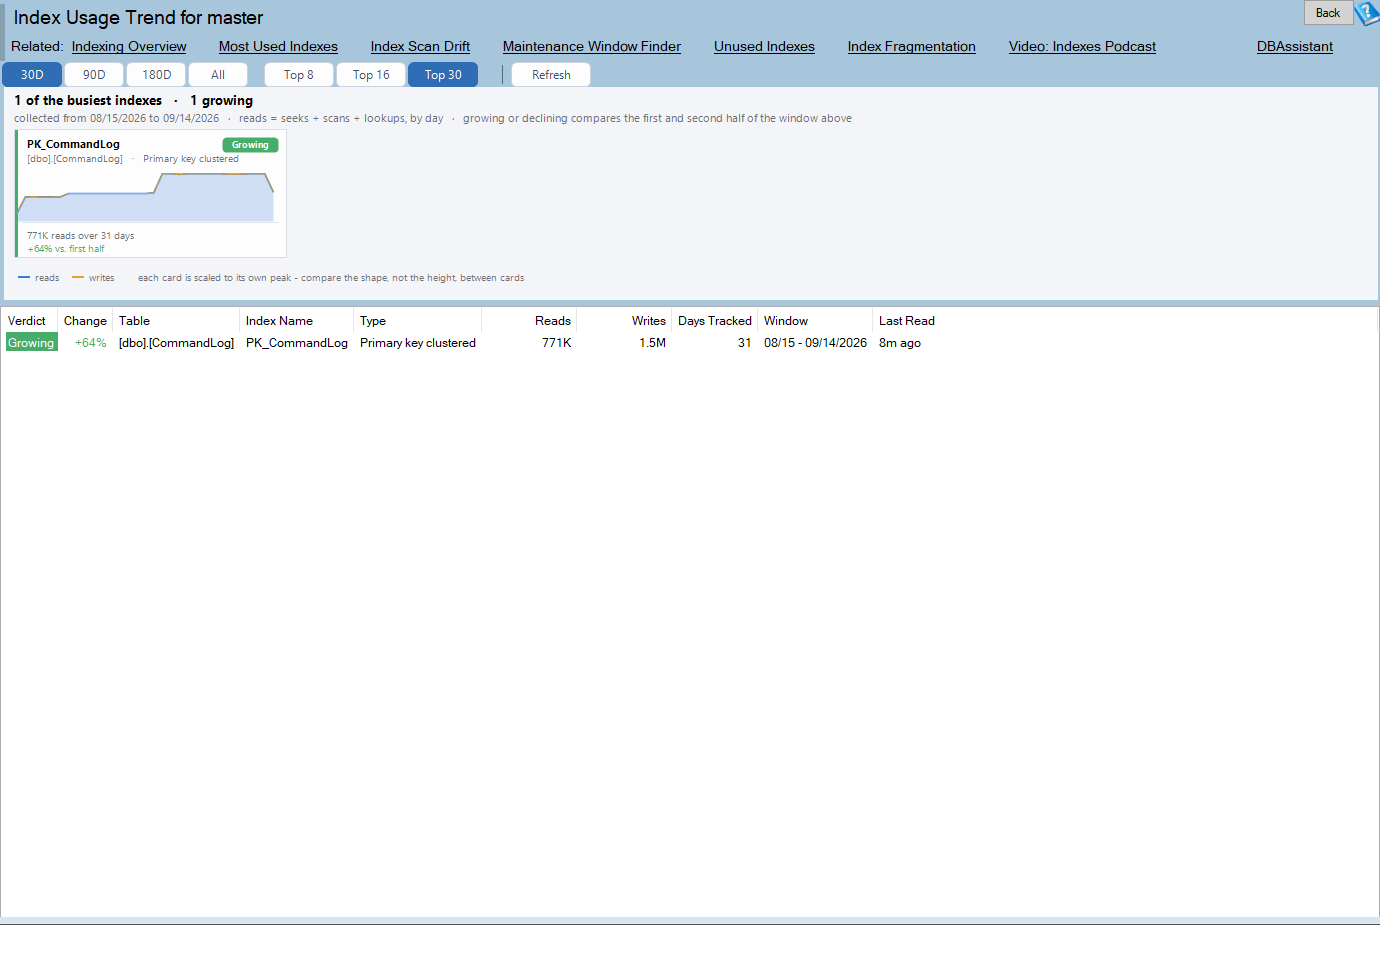
Each index gets a sparkline card. Daily reads are a filled blue line, writes are a thin amber one, and a verdict chip sits in the corner. Every card is scaled to its own peak, so compare the shapes between cards and ignore the heights.

| Verdict | What it tells you |
|---|---|
| Growing | Clearly busier in the second half of the window than the first. |
| Declining | Clearly quieter in the second half, but not yet at zero. |
| Stopped | Read earlier in the window and silent since, well before Unused Indexes would notice. |
| New | Quiet at first and reading lately. Worth understanding before it looks unused later. |
| Steady | About the same all the way through. The ordinary case. |
| Not enough history | The window is too short or too sparse to call a trend fairly. |
Below the cards sits a grid with the same verdicts, plus the numbers behind them. Change is the percent move from the first half to the second. Reads counts seeks, scans and lookups over the window. Writes is index maintenance, which is not usage, so do not read it as a sign the index is wanted. Days Tracked counts days with at least one recorded read, and Last Read says how long ago the index was last touched.

The toolbar offers 30D, 90D, 180D and All, and Top 8, Top 16 or Top 30 cards. The Window column shows the span the collector actually returned. Ask for 90 days from a collector that started six days ago and you get six days, not ninety with a made-up head start. History older than roughly two months is also rounded onto fewer days by the collector's own rollup, so a real week of reading can appear as one spike with quiet days on either side. That is storage winning over resolution. It is not a hole in what happened.
A verdict of Not enough history is not a fault. It appears when the observed window is under eight days, or when fewer than four distinct days have a recorded read. Below that, comparing one half with the other is mostly noise, so ignore those cards until the collector has had a few weeks.
What to do with what you find
- Start with Stopped. These are the indexes headed for Unused Indexes, and here the explanation is still attached.
- Take each Declining index and check it against Most Used Indexes. A Critical index quietly fading here deserves attention before it changes category.
- Treat New with suspicion rather than applause. A newly busy index can mean a query changed, not that the index was just created.
- Leave Not enough history alone until the window fills in.
Two patterns are worth a second look. A Stopped index with a recent Last Read usually means an old spike was rounded onto a coarser bucket, so check the Window column before you decide it truly went silent. And an index that is Growing right after a deployment is usually a changed query finding it for the first time. Confirm with the application team before you call it a surprise.
Growing is not automatically good, either. An index can climb because a bad plan began scanning it. The report says what changed, not why. Double clicking a card opens Index Fragmentation on that index, and our earlier post, SQL Server Index Fragmentation: Stop Chasing the Percent, explains why the percentage there deserves the same skepticism as a raw read count. Once you know which indexes need work, Your SQL Server Maintenance Window Is a Guess. Measure It covers finding the right time to do it. The full column reference is in the Index Usage Trend documentation.
None of this needs a new habit, only an earlier look. If you would rather have a second pair of eyes on which indexes are safe to retire, that is a conversation we have often.
What to check on your own server
- Confirm the collector holds at least eight days of history for the database before trusting any verdict
- List the indexes that were read earlier in the window and have been silent since, and note each last read date
- Compare the window on every Stopped index against the collector's retention rollup before calling it dead
- Check each Declining index against its ranking on your most-read list before it changes category
- Ask the application team whether a deployment preceded any index that has started growing
Try Database Health Monitor Today
Index Usage Trend shows whether an index is still being read, drawn as a line per index, so a silent index is spotted weeks before its lifetime total says so. Database Health Monitor shows it on every instance you connect, in the time it takes to open the report.
Download Database Health Monitor and run the Index Usage Trend report against your own server. There is nothing to configure first, and you will know inside a few minutes whether it tells you something you did not already know.
Related reading: Who Gets SQL Server Email? Nobody Can Tell You. A look at how to find every address your SQL Server actually mails, including leavers, dead mailboxes and script-chosen recipients that no operator dialog shows.
Related reading: What Changed in the Query Plan Before It Got Slower. A companion piece walks through the alignment chart that lines up two execution plans operator by operator, so a seek that turned into a scan shows up as one red lane instead of a wall of XML.