
A batch job that took six minutes in January and forty minutes in August, with nobody having touched a line of code in between, is one of the most common tickets a consulting practice sees. The execution plan in Management Studio looks unchanged. The index maintenance job still runs on schedule every night. Ask around and most engineers will open a CPU graph before they ask what SQL Server waits by query actually looked like during that run, and that gap between what people check first and what actually answers the question is where a full day of investigation gets lost.
The instinct is almost always CPU first, because a CPU percentage is the number already sitting on a dashboard somewhere. When that comes back unremarkable, the next stop is usually an instance-wide waits page, and it will happily report that the server spent the afternoon queued on 'LCK_M_U' or 'PAGEIOLATCH_SH'. Both numbers are true, and both are dead ends on their own, because neither one says which query was responsible for any of it. A team can lose a full day rewriting a stored procedure to fix a plan problem it never had, when the real cause was three other sessions holding a lock on the same table the whole time.
What SQL Server waits by query actually shows
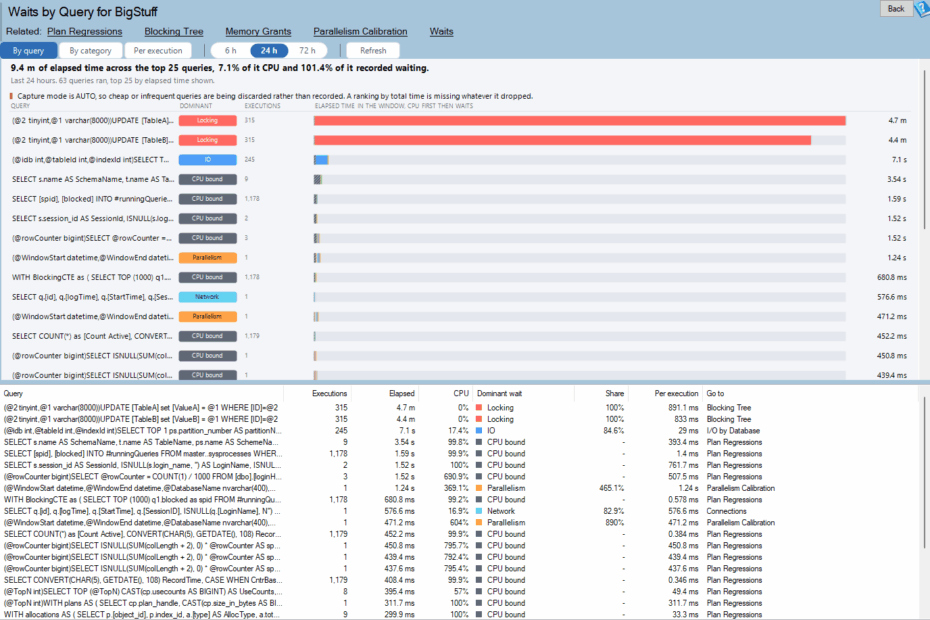
Every query's elapsed time is made of exactly two things: time the processor spent actually running it, and time it spent waiting on something else to get out of the way. Almost nothing in a default SQL Server setup puts those two numbers side by side for one query. This report does exactly that. It takes each query's total elapsed time in a chosen window and draws it as a single bar, split into the CPU it burned and the categories, lock, memory, parallelism, I/O, latch, network, it waited in instead. A procedure whose bar comes back mostly CPU needs a better plan. The same procedure with a bar that is mostly one wait color needs a completely different conversation, usually about what else was touching that table at the time, and no amount of rewriting the query will move that number.
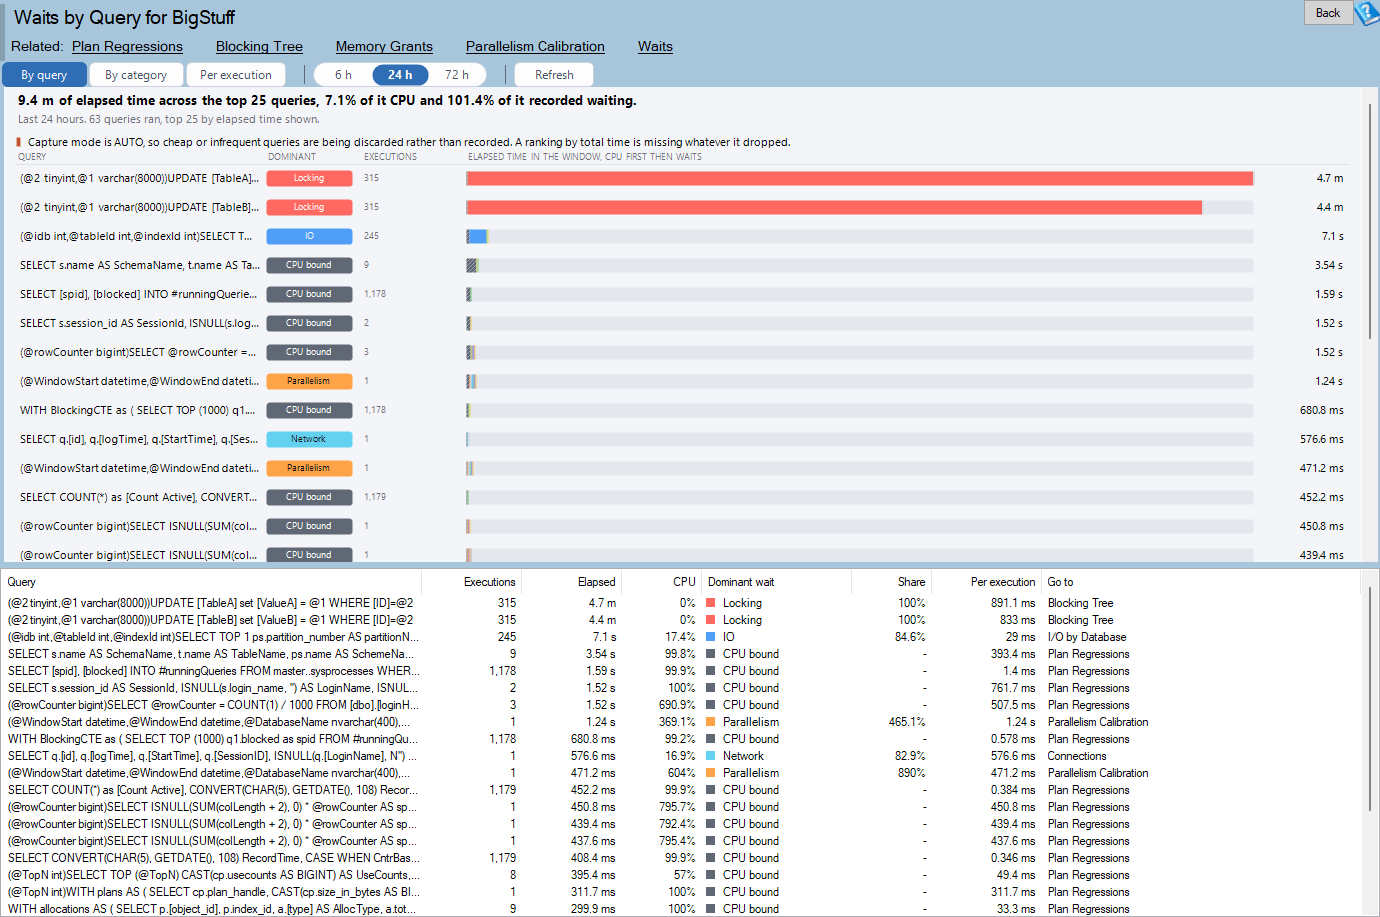
Waits by Query is one of the reports in Database Health Monitor. It runs against your own servers, and it takes about a minute to have this same screen open on one of them.
The last column is the point
Naming the wait is only half the job, because a wait category by itself does not tell anyone what to do next. So each row on this page points somewhere: pick the largest category a query waited in, and that is the report that owns the next question.
| Dominant wait | Where to look next |
|---|---|
| Lock | Blocking Tree |
| Memory | Memory Grants and Spills |
| Parallelism | Parallelism Calibration |
| I/O | I/O by Database |
| Transaction Log | I/O by Drive |
| Latch | TempDB Metadata Contention |
| Network | Connections |
| CPU bound | Plan Regressions |
A row with no strong wait at all, idle time and user waits, gets no destination on that list, because that stretch of time is the application thinking, not the database working. Everything else on the list already had a report built for it before this one existed. What was missing was the line connecting a specific query to the right one, so a reader stops guessing which of eighty reports to open next.
Two switches that leave the page empty
Two things have to be true before any of this draws anything. Query Store has to be turned on for the database, which most shops now do by default. Wait capture, though, is a second and separate switch, 'WAIT_STATS_CAPTURE_MODE', and it can sit off while Query Store itself reports 'READ_WRITE' and looks entirely healthy. The result is a page with nothing on it, and that reads exactly like a quiet database rather than a database that has simply never been asked to record its waits. It is worth ruling out before anyone concludes a system has no contention at all. The report is also only available on SQL Server 2017 and newer, a version later than the rest of Query Store, because the catalog view behind it was not part of the original 2016 release.
- Query Store must be on for the database, not just installed on the instance
- 'WAIT_STATS_CAPTURE_MODE' must also be on, separately from Query Store itself
- SQL Server 2017 or newer, since the wait statistics catalog view did not exist in 2016
- Nothing is captured retrospectively, so a freshly enabled database stays blank until the current interval closes
Reading the grid
- Query, Executions and Elapsed: what ran, how often, and how long altogether across the window
- CPU: CPU's own share of that elapsed time
- Dominant wait and Share: the largest wait category, and how much of elapsed time it accounts for
- Per execution: elapsed time divided by executions, which surfaces the query that is genuinely slow rather than merely frequent
- Go to: the report that owns whatever the dominant wait turned out to be

What to do with the answer
There are three ways to look at the same numbers. By query is the default, and the place to start, because most people arrive already knowing which query is slow and wanting to know why. By category turns the same window sideways, one row per wait category instead of per query, and it earns its place as a check rather than a starting point: if one category dominates nearly every bar on the page, the problem belongs to the instance, not to any single piece of code. Per execution divides the same bars by how many times each query ran, and that view catches the query that is quietly slow every single time rather than the one that simply runs the most.
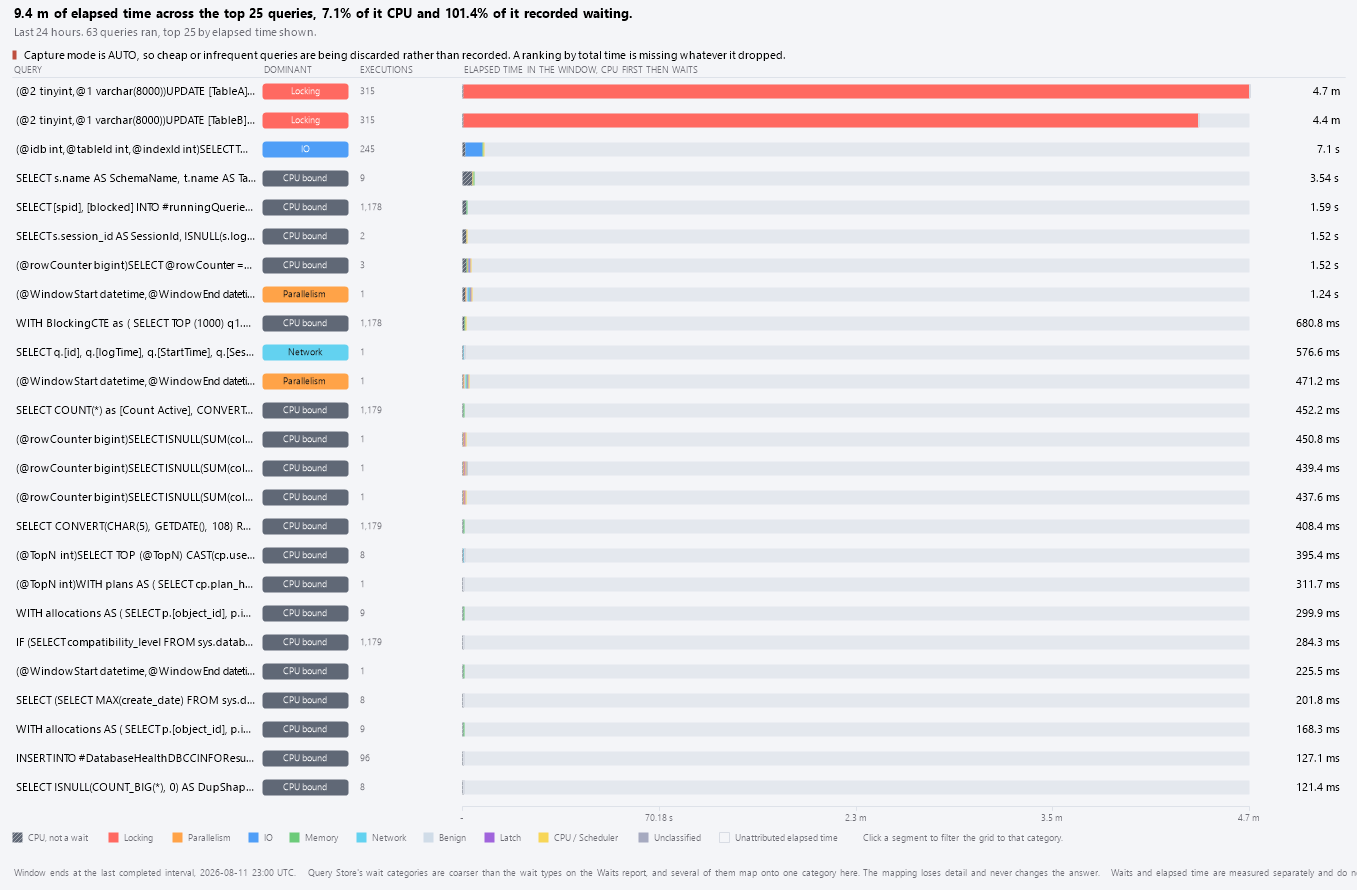
Clicking a segment on the chart filters the grid down to the queries that waited in that category. Double-clicking a row opens the full split next to the statement text, with the same category guidance the instance-level waits totals already use, so a colour learned on one page means the same thing on the other. Right-clicking a row jumps straight to the report that owns the problem.
A query that is mostly CPU needs tuning. The same query mostly waiting on a lock needs an entirely different conversation, and rewriting it will not move the number.
This is a narrow slice of data that Query Store already collects and almost nobody looks at on its own, and the difference it makes to a five-minute investigation is not subtle. The alternative, seen often enough across enough client servers to call it a pattern, is a day spent rewriting a query that was never the problem, followed by the same day spent again a month later on a different query, for the same wrong reason.
Try Database Health Monitor Today
It ends the guessing between a query that needs a better plan and one that just needs something else to stop blocking it. Database Health Monitor shows it on every instance you connect, in the time it takes to open the report.
Download Database Health Monitor and run the Waits by Query report against your own server. There is nothing to configure first, and you will know inside a few minutes whether it tells you something you did not already know.
Related reading: How to Track SQL Server Table Size Before It Surprises You. A related post walks through the Table Sizes report, which ranks every table by reserved space and shows how much of a database sits in just a handful of tables.
Related reading: SQL Server Index Fragmentation: Stop Chasing the Percent. A related piece walks through why SQL Server index fragmentation reported as a bare percentage points a DBA at the wrong index first, and what pages out of order gets right instead.
Related reading: SQL Server Query Slow When Busy? Find Out Which Kind. This post shows how to tell a query that is slow on its own from one that only slows down when the database is busy, using the same Query Store history.