
Across the client servers we look at, the same scene repeats. Something broke on Saturday night. By Monday morning the server is healthy again, and nobody can say what happened. The evidence usually exists. It sits in the SQL Server error log, in an archive file nobody opened, under several thousand identical backup lines. The log did its job. The reading is what failed.
How do I read the SQL Server error log without drowning in noise? The SQL Server error log records fatal errors, failed logins, I/O retries and routine backups in one timestamped stream. To read it well, classify each line by severity and category, group repeated messages, search the retained archives instead of only the current file, and view the lines around any entry. Error 825 and clustered 18456 failures deserve attention first.
That gap is what Database Health Monitor closes with its Error Log report, and it is worth understanding why the gap exists before looking at the screen.
In this post
- Why the log gets ignored
- Measure the shape, not the lines
- The SQL Server error log on one screen
- Lanes that line up
- Three patterns worth a second look
- Read the lines around the one you opened
- Keeping the log fast and findable
- Where the trail goes next
Why the log gets ignored
The usual approach is to open the log viewer in SSMS, scroll, and search for the word error. It feels thorough. It is not.
First, the viewer starts on the current file. If the log was cycled on Sunday night, whatever happened on Saturday is now one archive back, and most people never think to look there. Second, a busy instance writes the same couple of dozen messages thousands of times. Log backups, clean consistency checks, logins succeeding. The one line that matters is a needle in a haystack made of other needles.
Third, and this is the one that costs real money, severity is a poor guide. SQL Server writes a failed login at severity 14. That is the same level as a typo in a query against a table that does not exist. Anyone who filters by severity to find the serious lines is quietly filtering out the most security relevant entry in the whole file.
And on an instance whose log has never been cycled, the file holds everything since the last restart. Reading all of it can mean several hundred thousand rows crossing the wire before you see a single one.
Measure the shape, not the lines
A log is not a list of sentences. It is an event stream, and every event carries a time, a source, a message, and often a severity and an error number. Treat it that way and the questions change. Not what does line 40,112 say, but which message repeats most, which hour was loudest, and which subsystems spoke at the same moment.
Those three questions are far easier to answer than reading. They are also the honest ones. A count of a single message tells you more than the message does. Two hundred and thirty-one failed logins in a minute is an event. One failed login is a Tuesday.
So the useful measures are these. How many entries fall in each class. How many distinct messages sit behind the total. How long the gap is between rows. How many distinct accounts show up in the security lines. None of that requires scrolling.
The SQL Server error log on one screen
The Error Log report is an instance level report. Right-click the server, choose Instance Level Reports, then Error Log. Everything above is on the page at once.
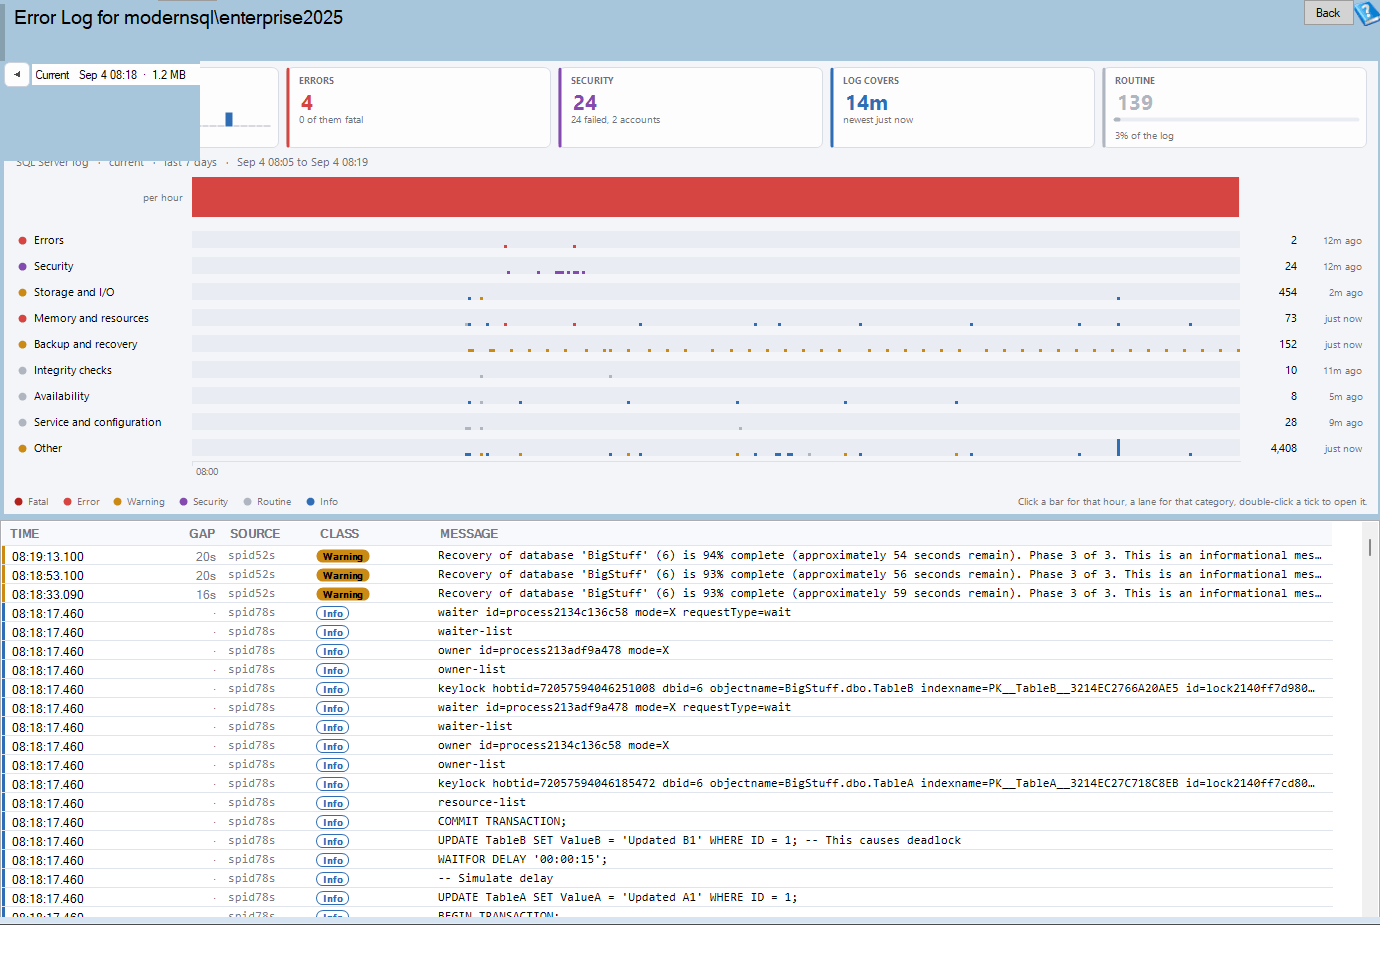
Error Log is one of the reports in Database Health Monitor. It runs against your own servers, and it takes about a minute to have this same screen open on one of them.
Five tiles sit across the top. Entries is every line read before any filter. Errors counts severity 17 and above plus anything that produced a stack dump. Security covers logins, permissions and audit, and shows how many distinct accounts were involved. Log covers is the span between the oldest and newest entry returned. Routine counts the background chatter, whether or not it is currently on screen.
Every line gets a class: Fatal, Error, Warning, Security, Routine or Info. Fatal means severity 20 to 25, or a stack dump, or an assertion. Error means severity 17 to 19, which is resource exhaustion and internal problems rather than user mistakes. Warning picks up I/O taking longer than 15 seconds, configuration changes and databases going into recovery.
Security is its own class on purpose, for the severity 14 reason above. Failed logins are never hidden by the Hide routine switch. That matters, because an earlier version of the filter did hide them, and the fix was to stop treating them as benign.
Lanes that line up
The chart has four views on a segmented control. The one you will use most is Time. It draws one lane per category with one tick per entry, and every lane shares a single axis.
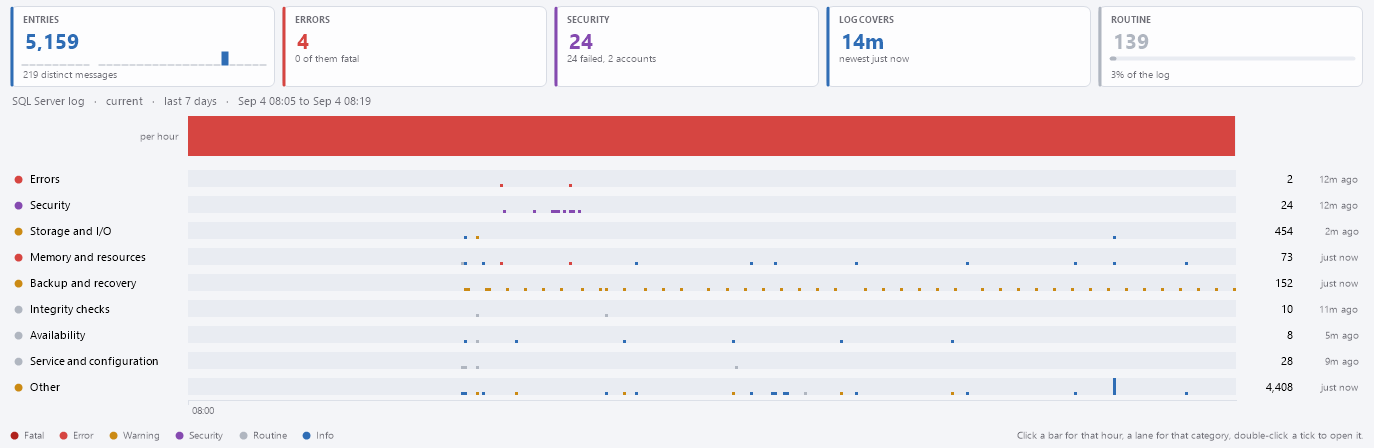
The density inside a lane is that subsystem's rhythm. A backup lane that looks like evenly spaced clumps is a schedule. A storage lane that turns into a solid rug from Tuesday onward is a disk in trouble. Because the axis is shared, anything that lines up vertically happened together. Three lanes lighting up in the same column at 02:14 is one incident, not three.
Click a histogram bar and the grid narrows to that hour. Click a lane and it narrows to that category. Double-click a tick and the entry opens in the detail pane.
The other three views answer narrower questions. Messages draws one bar per distinct message with the variable parts stripped out, biggest first. This is the view that makes a log readable at all. Sources draws one bar per log source, split by class, and tells you whether the noise is the engine, a subsystem or a single session. Clock is a 24 hour dial with two rings. The outer wedge is everything written that hour, and the inner overlay is only the serious part. A tall wedge that is all outer ring is a schedule. A short wedge that is mostly inner ring is the one to open.
Three patterns worth a second look
Error 825. This is a read that eventually succeeded, but only after it failed and was retried. Nothing failed where a user could see it, which is exactly why it gets missed. It arrives before the louder 823 and 824 errors. The storage layer is already handing back bad data some of the time. If you find one, run a consistency check and look at the disks, not at SQL Server.
A cluster of 18456 failures from one account. The message alone is not enough. The state number inside it tells you what went wrong, and the fixes differ.
| State | Meaning | Where to look |
|---|---|---|
| 5 | The account does not exist | The application or connection string naming the wrong login |
| 8 | The password is wrong | A stale credential held by a service or a job |
| 11 or 12 | A valid login denied server access | Permissions on the server, not the password |
Resetting a password because of a state 5 failure wastes an afternoon. Reading the state first saves it.
A storage lane and a security lane in the same column. Two symptoms with one cause, and the cause is usually the machine underneath rather than the database engine. We have seen teams chase a login problem for a day when the host was struggling.
Two more signals are easy to overlook. A Log covers tile reading months means the log has not been cycled in a long time, so every read is slow and every search is worse. And an empty Routine tile is not good news. Either the instance really is quiet or something is wrong with what is being logged.
Read the lines around the one you opened
A SQL Server error is almost never one line. The entry for 825 reads Error: 825, Severity: 10, State: 2. and by itself says nothing. The sentence that explains it is the next line down. Stack dumps, failed login blocks and consistency check output are all several consecutive lines.

So the detail pane shows the timestamp and source, the error number, severity and state parsed out of the text, and the surrounding lines in file order with your entry marked. For the errors that earn one, it adds a plain explanation. Previous and Next walk the grid without closing the pane.
The grid helps before you get that far. The stripe on the left edge carries the class, so you can run your eye down the column and find the worst rows without reading a word. The Gap column shows the time since the previous row, which is how a burst looks like a burst. And Group collapses everything to one row per distinct message with a count, first seen and last seen.
Keeping the log fast and findable
The picker lists every archive the instance still holds, with its date range and size, and the arrows step backward through them. Higher numbers are older. Archive 1 is the file before the current one, and cycling shifts every number up by one. The same reader handles the SQL Server Agent log, switched with a single control.
The toolbar's window and search are the performance controls. Both are passed to xp_readerrorlog, so SQL Server filters before anything crosses the wire. That is why the window defaults to seven days. The default has to be fast in the worst case, and the worst case is an uncycled log. Switch to All when you want everything.
There is a hard limit worth knowing about. SQL Server keeps six archives by default, and once one ages out it is gone. No report can show you history the server has already thrown away. The retention count is a server setting, found under Management, SQL Server Logs, Configure in SSMS.
Cycling the log closes the current file and starts a new one, and it needs sysadmin. If you find the log covers months, cycle it, and consider a weekly agent job to do so. Listing archives uses xp_enumerrorlogs, which typically needs sysadmin or securityadmin. Without it the picker collapses to the current log and an amber band says why, so the page is never worse off. On Amazon RDS the report detects the platform and reads through rdsadmin.dbo.rds_read_error_log instead. Cycling is not available there.
The full reference, with every column and permission, is on the Error Log help page.
Where the trail goes next
A log entry is rarely the end of an investigation. It is the timestamp you carry somewhere else. If an agent job failed at the moment the log went loud, Failed Jobs and Job History will show it. If you want to know whether anyone was told, the Email Alert Log answers that, and our piece Why Your SQL Server Alert History Is Full of Noise explains how that signal gets buried too.
After anything in the 823, 824, 825 family, check when CHECKDB last came back clean. After error 3041, look at Backup Status. For connection errors that involve another instance, look at Linked Servers.
The pattern we see most is not a missing log. It is a log nobody has time to read. What that costs is the weekend you spend guessing. Reading it with structure, by class, by group and by time, turns that guess into a timestamp.
What to check on your own server
- Open the Error Log report on the seven day window and note the Errors and Security tiles
- Search every retained archive for error 825 and treat any hit as storage returning bad data
- Check the state number on each cluster of 18456 failures before you change any login or password
- Compare the Log covers tile with your habits and schedule a weekly agent job to cycle the log if it reads months
- Confirm how many archives your instance keeps, six by default, before an incident ages one out
Try Database Health Monitor Today
The Error Log report turns a wall of thousands of log lines into a few classified, grouped messages you can read in minutes, across every retained archive. Database Health Monitor shows it on every instance you connect, in the time it takes to open the report.
Download Database Health Monitor and run the Error Log report against your own server. There is nothing to configure first, and you will know inside a few minutes whether it tells you something you did not already know.
Related reading: SQL Server Memory Usage: Where Did All the RAM Go?. This post follows server memory from the machine down to each database's cached pages, and explains which four numbers separate a healthy full server from one that is starving.
Related reading: Availability Group Lag: What a Failover Would Cost You. Explains how to read the send and redo queues as data loss and recovery time for every database on every secondary, so you know what a failover would really cost.