Every DBA has watched a maintenance job creep later each week: the reindex that finished by 3 a.m. in January is still running past 7 when the first users log in by June. Backups take longer too, and a drive that had a year of headroom left suddenly does not. Nobody has actually checked SQL Server table size since the database went live, so the growth gets blamed on 'the database' in general instead of on whichever table is actually driving it.
How do I check SQL Server table size across every table in a database? SQL Server table size is best measured as reserved space per table, not row count. Rank every table by pages allocated in sys.allocation_units, then check how many tables hold half the database. Usually a handful account for most of it, and that concentration is what a restore, migration or DR test really depends on.
The Number Everyone Checks First, and Why It Misleads
When growth shows up like that, the first move almost everywhere is the same: run +sp_spaceused+ against whichever table already has a reputation, or sort a list by row count and assume the one at the top is the problem. Both feel like data. Neither answers the question. Row count says how many rows live in a table, not how many bytes they carry, and a table with eight hundred million narrow integer rows can reserve less space than a staging table holding eight thousand rows of scanned documents. Checking one table at a time also assumes you already know which table to check, and the one actually driving a backup, a restore or a DR test is not always the one anyone would have guessed.
Reading SQL Server Table Size the Right Way
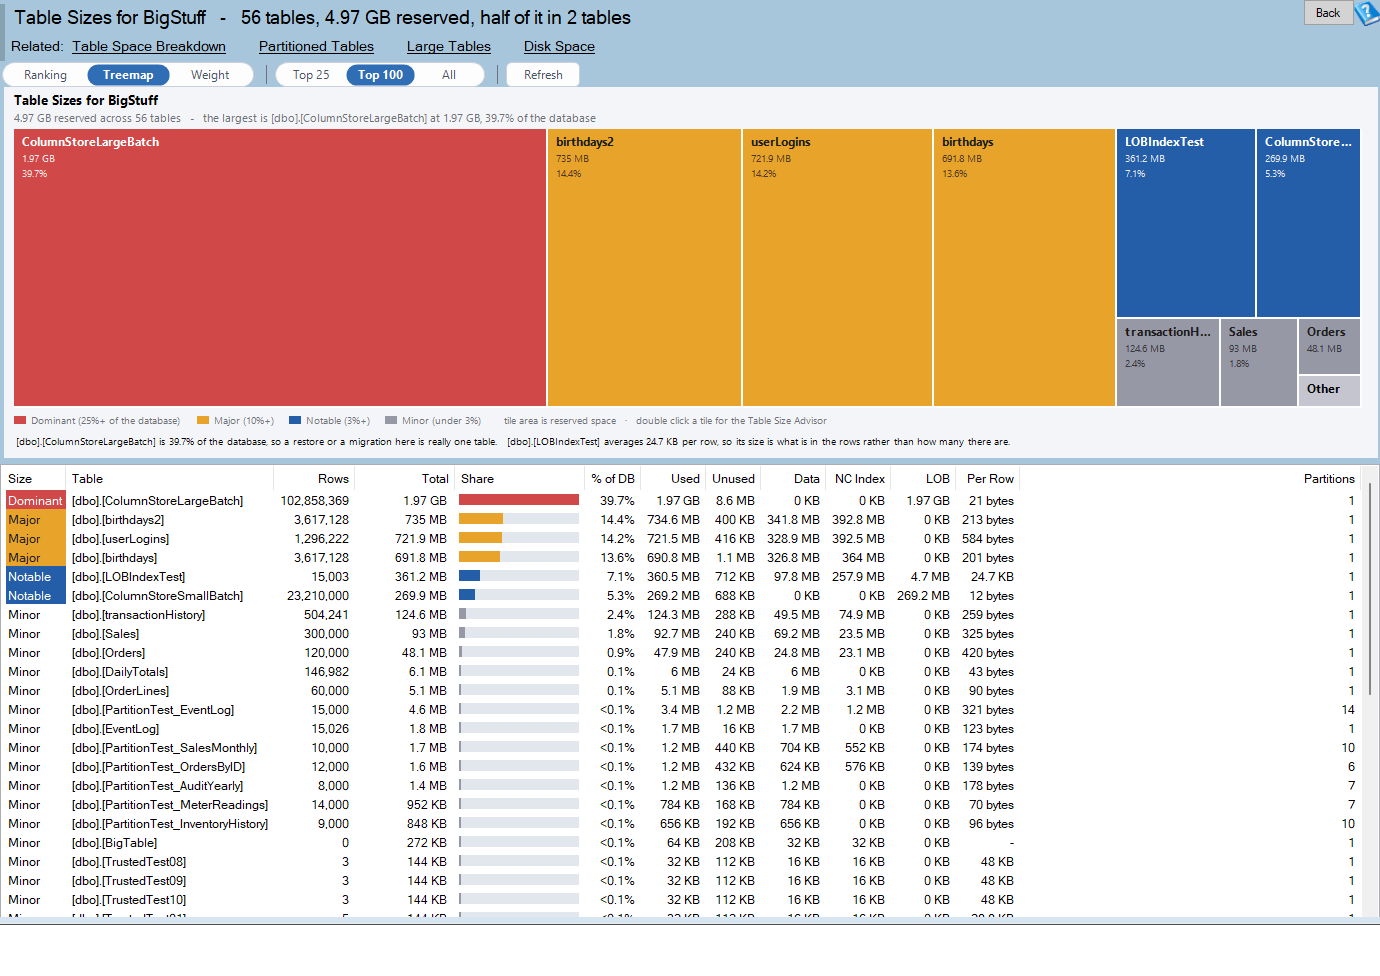
Table Sizes is one of the reports in Database Health Monitor. It runs against your own servers, and it takes about a minute to have this same screen open on one of them.
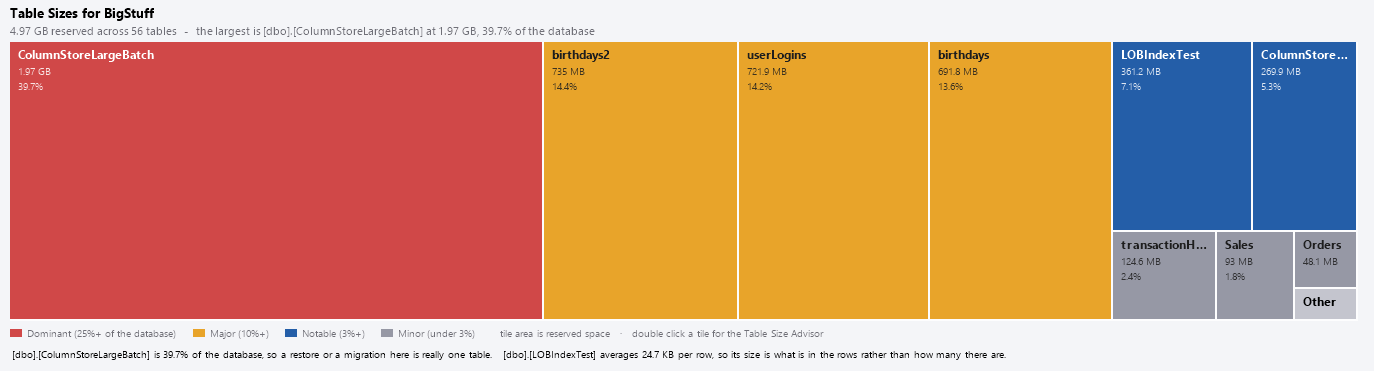
The honest number is reserved space, ranked across every table in the database at once rather than sampled from the one or two tables everyone already suspects. The report draws the largest tables as bars and sums everything smaller into one last row, and above those bars sits a single strip: the whole database drawn as one bar, split block by block in size order, each block as wide as that table's own share. Because the blocks run end to end, the point where the strip crosses halfway is the point where half the database's reserved space has been accounted for, and a caption underneath spells out exactly how many tables that took. A database where the answer is one or two tables gets planned around very differently than one where it takes two hundred.
| Band | Share of the database | What it means |
|---|---|---|
| Dominant | A quarter or more | No restore, migration or DR test of this database is really complete until it accounts for this table |
| Major | A tenth or more | Worth knowing about before that same job gets scheduled |
| Notable | 3 percent or more | A visible slice, worth a glance |
| Minor | Under 3 percent | The long tail everyone assumed was the whole database |
Rows or Bytes: Why a Table Is Actually Big
Ranking answers which table is big. It does not answer why, and why is what decides what happens next. Two tables can land at the same size on the ranking and need completely different fixes: one because of how many rows it has, the other because of what is packed into each one. This report has a separate view for exactly that question, plotting row count along one axis and bytes reserved per row along the other, both on log scales because the two span several orders of magnitude in an ordinary database.
A table with few rows and heavy ones is big because of its columns, likely LOB or off-row content, and no amount of archiving or index tuning will shrink it. A table with many rows and light ones is big because of row count, and that is the one where partitioning or an archiving job actually moves the needle. A faint diagonal line or two marks a constant total size across the plot, so a bubble sitting above one is bigger than that line's label and a bubble on it is roughly that size, without reading a single number off an axis.
Turning the Ranking Into a Plan
Everything above the fold is also in a grid underneath it, one row per table with every partition already summed in, so a fifty partition table reads as one table rather than fifty medium ones skewing the ranking. Clicking a bar selects its grid row and back again, and a line under the chart calls out the single most useful fact about the dominant table, the heaviest rows or the worst unused space, whenever there is something worth saying.

Once the dominant table has a name, the next question is usually whether its size is also costing time, not just disk. If that same table keeps showing up in slow queries, SQL Server Waits by Query: Find What's Actually Slow is the report that turns those queries into an actual wait number instead of a guess.
A job that runs a little longer every week is not a mystery once the table behind it has a name and a number attached. What used to take a spreadsheet built from a dozen +sp_spaceused+ calls, sorted and re-sorted by hand, is now one screen that never lies about which table is actually the database.
What to check on your own server
- Rank your tables by reserved space, not row count, before assuming which one is biggest
- Check how many tables together account for half your database's reserved space
- Note whether your largest table is a quarter or more of the database before your next restore or DR test
- For any table whose size is a surprise, compare its row count against its bytes reserved per row
- Check whether LOB or off-row content, rather than row count, explains a heavy table's size
Try Database Health Monitor Today
This report shows in one screen which tables are actually driving a database's growth and space use, instead of leaving you to guess from row counts alone. Database Health Monitor shows it on every instance you connect, in the time it takes to open the report.
Download Database Health Monitor and run the Table Sizes report against your own server. There is nothing to configure first, and you will know inside a few minutes whether it tells you something you did not already know.