
Someone says the SAN is slow. Users are complaining, the ticket queue is growing, and the storage team replies that their graphs look flat. We see this exchange in shops of every size, and the argument about SQL Server disk latency right now almost never settles, because nobody is holding a number from the right ten minutes.
How do I see SQL Server disk latency right now, not the average since startup? To see SQL Server disk latency right now, read the file counters twice, 10 to 60 seconds apart, and divide the stall by the I/Os in that window for each database file. Lifetime averages hide short storms. Judge data files against 10 and 20 ms, log files against 5 and 10 ms.
Database Health Monitor has a report built for exactly this argument, called Storage Latency Now. First, though, the number most people reach for deserves a hard look.
The average that makes everyone look innocent
The usual first move is to read sys.dm_io_virtual_file_stats and compute milliseconds per read. It is a fair instinct. The trouble is that those counters only ever grow. They start at zero when the service starts, so every figure you derive is an average over the whole uptime.
Picture a storm at 3 pm that lasts ten minutes. Average it into three weeks of quiet and it disappears. The DBA reports healthy disks, the storage team agrees, and the users were still staring at spinning cursors. Both sides are telling the truth. They are just measuring different things.
Per-drive history helps with "what happened on Tuesday", provided something was collecting it. It does not help with "what is happening this minute". That question costs real money when it drags on, because every hour spent arguing is an hour of slow orders, slow reports or a stalled batch.
Measure the difference, not the total
The honest number is a delta. Read the counters, wait, read them again, and subtract. Stall divided by I/Os in that window is what one read or one write actually cost while you were watching, and you can set the window to 10, 30 or 60 seconds.
That turns a vague complaint into a sentence you can act on. The log file of one database waited 38 ms per write for the last minute while an index rebuild and a checkpoint of 90,000 pages were running. Nobody can argue with that, and nobody has to guess which team owns it.
Storage Latency Now is one of the reports in Database Health Monitor. It runs against your own servers, and it takes about a minute to have this same screen open on one of them.
Reading SQL Server disk latency right now, file by file
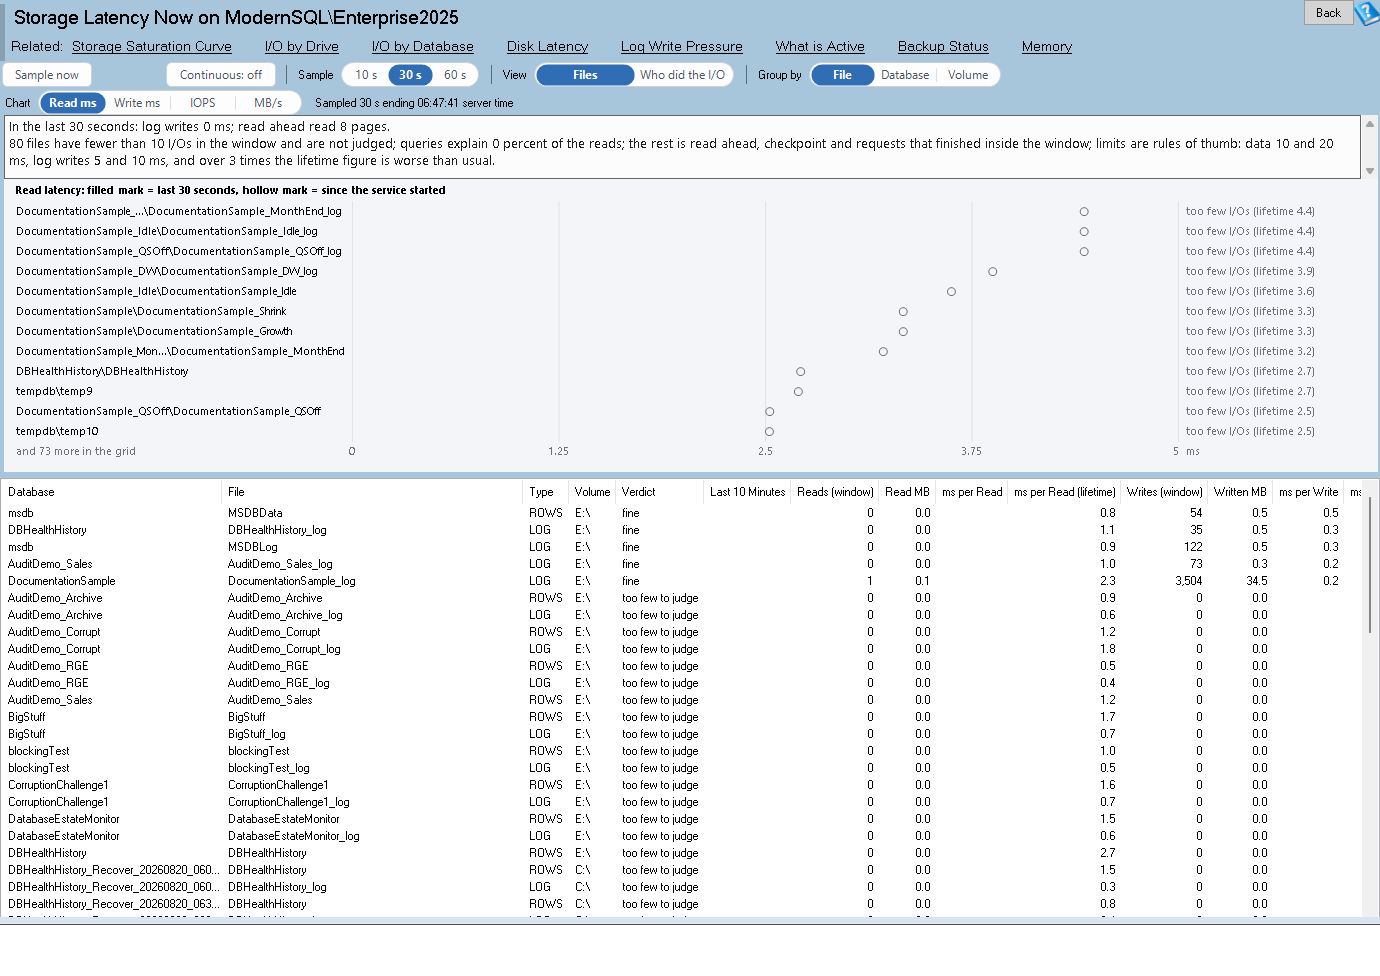
The page opens with a single sentence: average data read latency, the slowest file, log write latency, the I/Os pending and the oldest of them, the biggest background writer, and any backup, restore, DBCC or rebuild that was running. Below it, a chart draws one lollipop per file. The filled mark is the window and the hollow mark is the lifetime average. A big gap between them is the whole story.
The grid carries the detail: reads, writes, milliseconds per I/O for both the window and the lifetime, the pending count, and the age of the oldest pending I/O. Two design choices matter here. A file with fewer than 10 I/Os in a direction is left blank rather than judged from a handful of samples. And any Resource Governor queue time is subtracted from the stall and shown in its own column, so a throttled pool is not blamed on the disk.
Verdicts follow the rules of thumb most of us already use, and they are only that. Tempdb is judged as a data file.
| File | Fine | Watch | Slow |
|---|---|---|---|
| Data file reads and writes | under 10 ms | 10 to 20 ms | over 20 ms |
| Log file writes | under 5 ms | 5 to 10 ms | over 10 ms |
Two extra rules catch what thresholds miss. A window latency above three times the lifetime figure is raised to at least watch, however small the numbers. And an I/O pending for more than 100 ms is a watch, more than 1,000 ms a slow.
Who did the I/O
A latency number tells you the disk was busy. It does not tell you why. The second view lists running requests with the reads and writes each did in the window, plus the database, command, wait type and statement. Each gets a share of all reads, so a single scan that explains most of the traffic is obvious at a glance.
The grid then lists the background writers: checkpoint, lazy writer, read ahead, and backup and restore throughput. This is how a slow data file turns out to be a checkpoint flush and not a query at all. If you are chasing a log-side symptom specifically, our post on WRITELOG Wait: Slow Storage or One-Row Commits? covers how to tell a slow device from a chatty application.
A few practical points. The report needs SQL Server 2008 or newer and the VIEW SERVER STATE permission. Without that permission it says so rather than throwing an error. A sample takes as long as its length, but the reads themselves are cheap, so it is safe to run while users are suffering. Continuous mode chains samples together and fills a trend column covering the last ten minutes.
The full column reference is in the Storage Latency Now documentation. The short version of the lesson: ask for the window, not the lifetime. Once the delta is on the table, the conversation with the storage team changes from opinion to evidence, and that is usually worth the ten seconds it takes.
What to check on your own server
- Compare your I/O by Drive average with a 30 second sample taken while users are complaining
- Check log file writes against 5 and 10 ms and data file reads and writes against 10 and 20 ms
- Note any file where the window latency is more than three times its lifetime figure
- Look at which running request has the biggest share of the reads in the window
- Run a sample around a checkpoint or index rebuild to see background writers claim their share
Try Database Health Monitor Today
Storage Latency Now turns "the SAN is slow" into a per-file, per-minute number with the sessions and background writers that caused it. Database Health Monitor shows it on every instance you connect, in the time it takes to open the report.
Download Database Health Monitor and run the Storage Latency Now report against your own server. There is nothing to configure first, and you will know inside a few minutes whether it tells you something you did not already know.