
On Monday morning someone from the business asks a fair question: how much data would we have lost if the primary died at 2 AM on Saturday? The Availability Group dashboard is green. It was green on Friday too. Neither fact answers the question, because the estimated data loss at 2 AM is gone.
How do I see the estimated data loss of my SQL Server Availability Group at a past time, like 2 AM last night? Estimated data loss is the amount of committed work a failover to a secondary would have lost at a given moment. A live page only shows now, so answering for last night needs lag sampled every couple of minutes and kept, then read back as the worst value and the minutes spent over your RPO.
We see this pattern across client environments of every size. A secondary falls behind during an index rebuild, a big batch or a network blip, then catches up, and by the time anyone looks the evidence has evaporated. Database Health Monitor has a report built for exactly this moment, called HA/DR History, and it starts from the honest idea that lag is a curve, not a number.
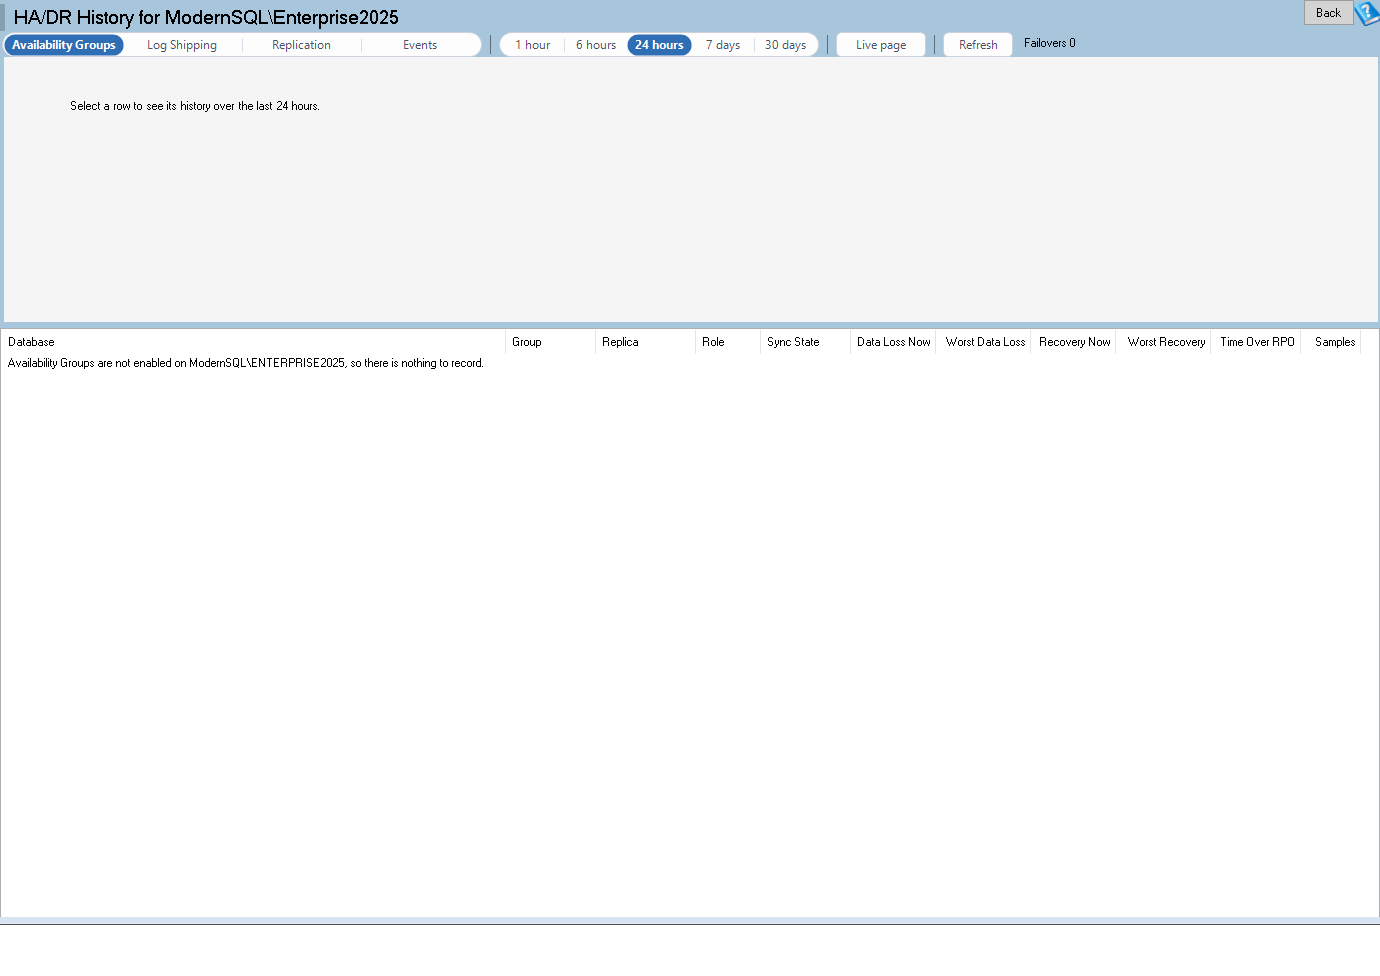
HA/DR History is one of the reports in Database Health Monitor. It runs against your own servers, and it takes about a minute to have this same screen open on one of them.
Why the live page cannot settle the argument
Most people reach for the live Availability Groups view first. It is accurate, and it is useless for this. It tells you the queues right now. It cannot tell you that the same replica sat 4 minutes behind at 2 AM, or that it stayed over target for half an hour.
The next stop is usually the error log, looking for a failover. That finds the event but not the exposure. A secondary that never failed over can still have been a very bad place to fail to.
The cost is not technical. It is an RPO promise nobody has ever checked, made to people who will quote it back to you after an outage.
Measure estimated data loss as a history, not a snapshot
Database Health Monitor samples this state about every 2 minutes per instance and keeps it in the DBHealthHistory database. Pick a window from 1 hour to 30 days and the report reads those samples back. For every database on every replica you get the data loss now, the worst in the window, the recovery time a failover would need, and the minutes spent over your RPO. Each sample stands for 2 minutes, so the arithmetic is simple.
Two details matter in practice. A row marked Stalled means redo is not progressing, and it ranks above any number, because a stuck secondary is worse than a slow one. And the report reads only the history database, so it opens even when the monitored instance is down. That is when you want it.
The line at the top is the summary. Something like Worst data loss 4 min 10 sec | Over RPO (1 min) 36 min | Failovers 1 is a complete answer to the Monday question in one glance.
Four tabs, one question each
| Tab | One row is | What it settles |
|---|---|---|
| Availability Groups | A database, group and replica | Data loss and recovery time, with failover, health, suspend and resume markers |
| Log Shipping | A primary database and secondary | Backup, copy and restore lag against the stored limits |
| Replication | A distribution agent | Delivery latency and undistributed commands, with a marker where the agent failed |
| Events | One thing that happened | Role changes, health changes, suspended data movement, over-threshold legs and agent failures, newest first |

Select any row and the chart above it redraws with that threshold as a line. Log shipping and replication get the same treatment, so one report covers every way a copy can fall behind.
What to do with the answer
Be careful with the numbers. The Availability Group figures are estimates built from the same rules as the live page. Read them as the RPO a failover would have had, not as a count of lost transactions. Samples are 2 minutes apart, so a spike shorter than that can slip through.
If the worst rows share a primary that struggles to harden its log, the cause may sit upstream of the secondary. Our post WRITELOG Wait: Slow Storage or One-Row Commits? covers how to tell storage from commit pattern.
Then stop finding out afterward. The report feeds four email alerts: 5031 for data loss exposure (60 seconds by default), 5032 for an unhealthy replica or a failover, 5033 for log shipping behind and 5034 for replication latency. Each sends an all clear when the condition ends. The full HA/DR History reference lists every column and limit.
What to check on your own server
- Check that the AG RPO setting matches the data loss your business was actually promised
- Open the Events tab for the last 7 days and note every role change and suspended data movement
- Compare Time Over RPO with Worst Data Loss for each replica, starting with any row marked Stalled
- Switch on alerts 5031 to 5034 in Email Alert Configuration, using the 60 second default for 5031 as a starting point
Try Database Health Monitor Today
HA/DR History keeps Availability Group, log shipping and replication lag as samples, so you can answer how far behind disaster recovery was last night. Database Health Monitor shows it on every instance you connect, in the time it takes to open the report.
Download Database Health Monitor and run the HA/DR History report against your own server. There is nothing to configure first, and you will know inside a few minutes whether it tells you something you did not already know.
Related reading: SQL Server Disk Latency Right Now: Is the SAN Slow?. A companion piece on telling a genuinely slow disk from a workload that only looks like one, by sampling file latency over a short window and naming the sessions behind it.