
We keep meeting the same server. CPU is idle, memory is healthy, and yet commits crawl at the busiest hour of the day. The top of the wait list says WRITELOG wait, and by the second meeting somebody has already requested faster disks. Sometimes that is right. Just as often the disks are nearly bored, and an application is committing one row at a time.
What causes a WRITELOG wait in SQL Server, and how do I fix it? A WRITELOG wait means commits are waiting for the transaction log to harden to disk, and it has two opposite causes: slow storage, or an application committing tiny transactions thousands of times a second. Comparing flushes per second, kilobytes per flush and write latency tells you which one you have, and therefore which fix to buy.
Database Health Monitor has a report built for exactly this fork in the road, called Log Write Pressure. It samples the write path of every transaction log and gives each database a verdict. First, though, it helps to see why the usual first move misleads.
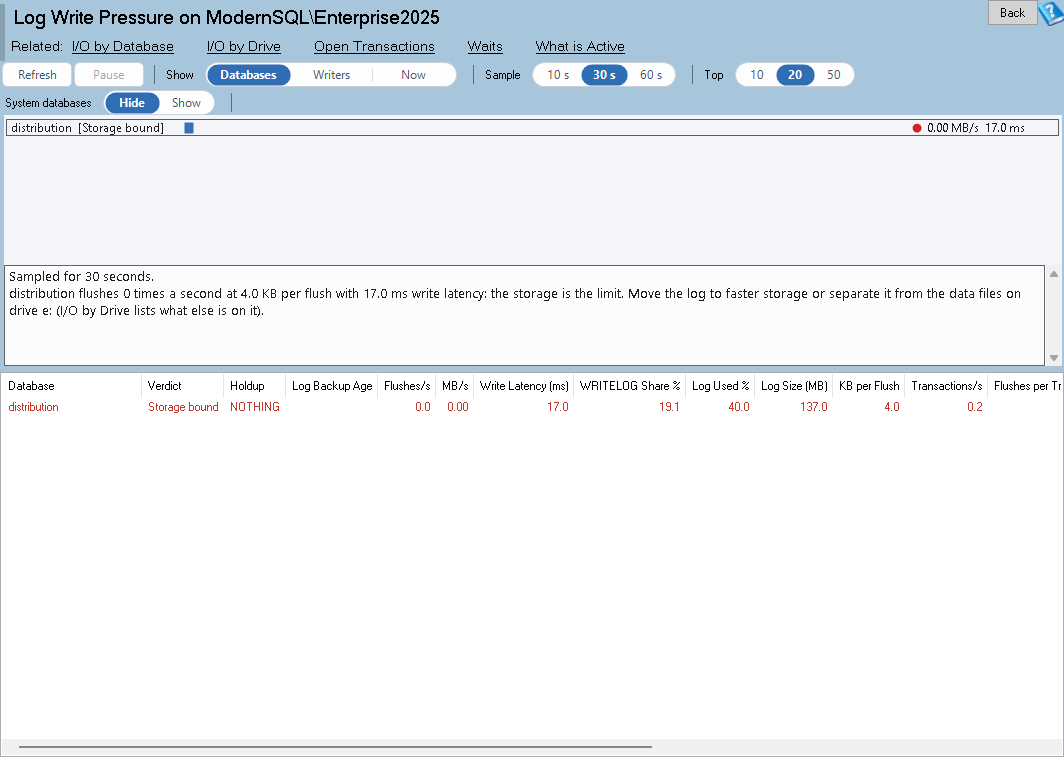
Log Write Pressure is one of the reports in Database Health Monitor. It runs against your own servers, and it takes about a minute to have this same screen open on one of them.
Why a WRITELOG wait alone tells you so little
Most people reach for the wait statistics, then for file latency per database. Both confirm that the log is slow to harden. Neither says why, and the why decides everything.
There are two causes with opposite cures. In the first, each log write simply takes too long, so the answer is storage: faster media, or a log that no longer shares a drive with something noisy. In the second, the writes are quick but there are far too many of them. Every commit forces its own flush, and each flush pays the full round trip. Faster disks help that case a little. Batching the commits helps it enormously.
Buy hardware for the second problem and you have spent real money to move the wait by a few percent. We have watched that happen. The cost is not only the invoice, it is the weeks before anybody looks again.
The numbers that separate the two
Over a short live sample, four measurements tell the story:
- Flushes per second. How often the log is forced to disk.
- KB per flush. Bytes flushed divided by flushes. A one-row commit flushes a single sector, so around 4 KB or less says small commits. Near 60 KB, you have hit the size of a single flush.
- Write latency. Time spent writing the log file divided by the number of writes. Under 2 ms is healthy, over 10 ms is a problem.
- Flushes per transaction. A value near 1 means every transaction is paying for its own flush.
Put those together and the two causes stop looking alike. Tiny flushes, enormous counts and low latency describe an application. Large flushes with slow writes describe a disk. The report also compares each database's share of the total log stall, so you know which one to chase first.
What the verdicts ask you to do
Each database lands in one of five verdicts, and each comes with a direction rather than a shrug.
| Verdict | What triggers it | Direction |
|---|---|---|
| Small commits | More than 500 flushes a second, under 4.5 KB each, latency under 3 ms | Batch the commits, or consider delayed durability |
| Storage bound | Latency over 10 ms with flushes over 16 KB, or a flush wait over 10 ms | Faster storage, or move the log |
| Saturated | 56 KB or more per flush at over 100 flushes a second | Batching will not help; storage latency will |
| Log full risk | Over 80 percent used with something holding truncation, or growth during the sample | Check log backups, open transactions and the VLF count |
| Fine | None of the above | Leave it alone |
Two more views finish the job. Writers ranks the statements that write the most log per day from Query Store, which is how you find the loop that commits inside a cursor. Now lists the requests waiting this moment, with statement, program and host, so you can name the culprit instead of a database.
For a Small commits database the report can offer a delayed durability script. It only copies it, never runs it, and it opens with a warning for good reason: you trade away the last few milliseconds of commits on a crash. Fine for a logging database, not for a ledger. The report also withholds the offer when the database sits in a synchronous availability group, is published for transactional replication or has change data capture on. If that first case is a worry on your estate, our look at Availability Group Lag: What a Failover Would Cost You covers the other side of that bargain.
The page needs SQL Server 2008 or newer and VIEW SERVER STATE. Some columns, such as active log size and VLF counts from sys.dm_db_log_stats, need 2017 or later, and they simply stay blank on older versions. Full column detail is in the Log Write Pressure documentation.
The point is a cheap one to prove. Ten seconds of sampling can save a purchase order, or save a month spent tuning an application that was never the problem.
What to check on your own server
- Sample the log write counters for ten to sixty seconds during your busiest hour, not at a quiet moment
- Compare kilobytes per flush with flushes per second for each database, since near 4 KB at high rates points at small commits
- Check write latency against 10 ms before concluding that the storage is the problem
- Rank the statements writing the most log per day from Query Store on SQL Server 2017 or newer
- Confirm a database is not in a synchronous availability group, replicated or using change data capture before considering delayed durability
Try Database Health Monitor Today
Log Write Pressure tells you whether a slow transaction log needs faster storage or an application that commits less often, before you spend money on the wrong one. Database Health Monitor shows it on every instance you connect, in the time it takes to open the report.
Download Database Health Monitor and run the Log Write Pressure report against your own server. There is nothing to configure first, and you will know inside a few minutes whether it tells you something you did not already know.