
Across the client servers we see, the same moment keeps arriving. Somebody wants to retire a database, or move it, or rotate the password on its login. The owner says nobody uses it. Then the old reporting server turns out to connect every Sunday night, and the change window becomes an incident. Asking who uses this database is cheap. Answering it badly is not.
How do I find out who uses this database before I migrate or decommission it? Look at 90 days of history, not the sessions connected right now. A census of logins, hosts and programs shows first seen, last seen, days active, CPU and reads. It also flags newcomers and anything gone quiet, so you can answer who uses this database with evidence before you move or retire it.
Database Health Monitor answers it from stored history rather than from memory or guesses, and the difference matters more than it first appears.
Why the live session list lies
Most people reach for sp_who2 or the activity monitor first. Both show who is connected at this moment. That is a snapshot, and a snapshot of a Tuesday afternoon says nothing about the month-end job, the quarterly audit export or the application that only wakes up on Monday.
Connected is also not the same as working. A pooled connection can sit open for weeks doing nothing, while a real consumer connects for four minutes a night and disconnects. The live list flatters the first and misses the second.
What you want is a count of days. How many days in the last 90 did this login, from this host, through this program, actually do work? That number separates regular use from a stale connection string nobody remembers.
What the 90 day census measures
The report merges two sources held in DBHealthHistory. The first is dbo.waitsNormalized, which records the login, host and program of each waiting session sample. The second is dbo.WorkloadByAppHistory, which records CPU, reads and writes per program, host, login and database every two minutes.
They cover different ground. The wait samples only catch a session that happened to be waiting when the sample ran, so short fast work can slip through. The workload table is complete for sessions that did work, but it only exists on the server hosting the history. If the database lives elsewhere, the page falls back to waits alone and tells you so. Treat what you see as strong evidence of use, not a full audit log.
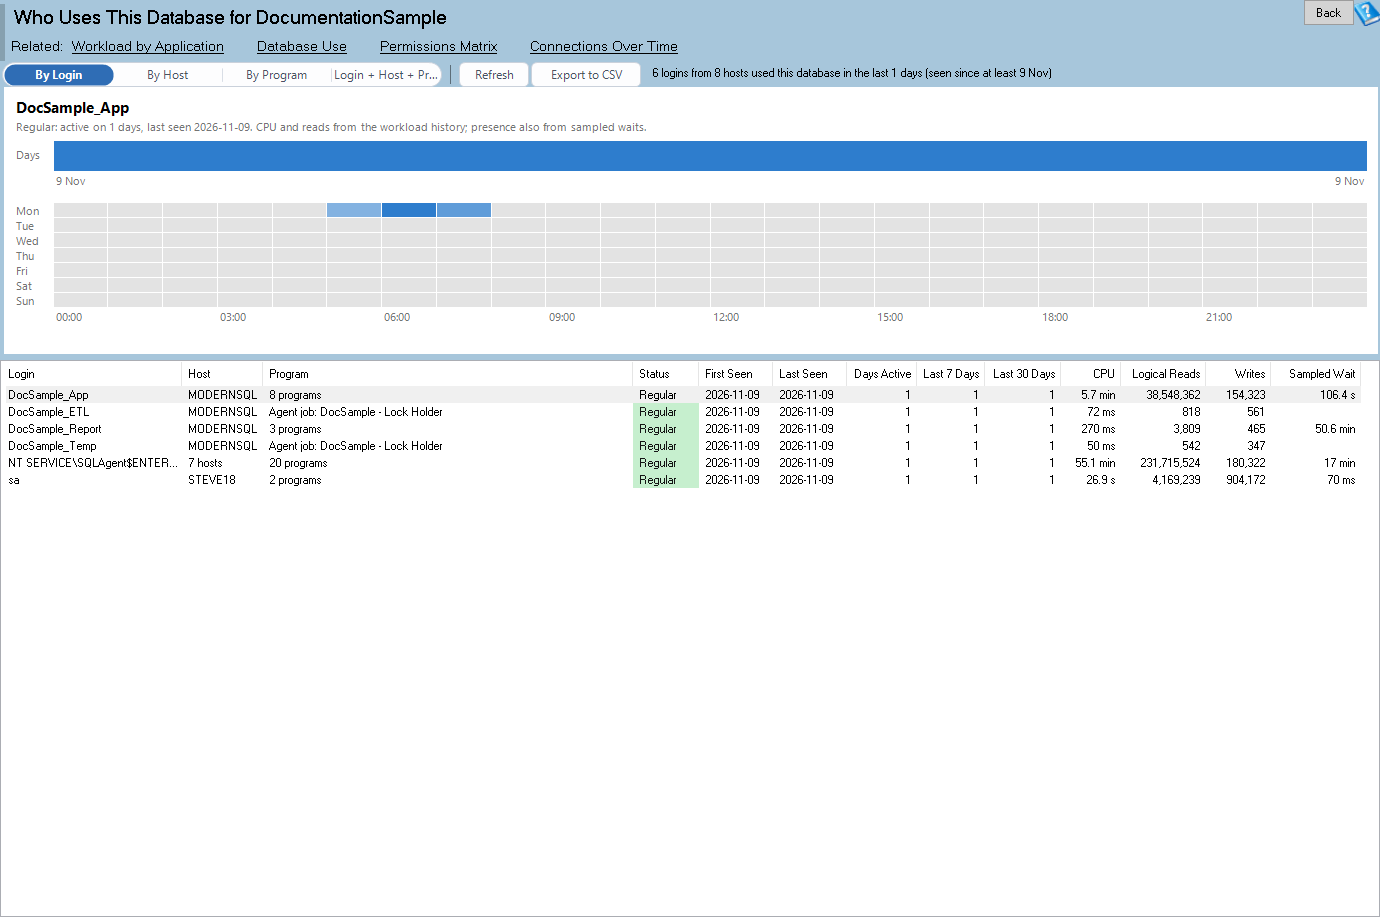
Who Uses This Database is one of the reports in Database Health Monitor. It runs against your own servers, and it takes about a minute to have this same screen open on one of them.
Each row gets a status, and the rules are plain. New means first seen in the last 14 days, with history reaching back further than that. Gone quiet means last seen more than 30 days ago. Regular means active on more than half the observed days. Everything else is Occasional.
Reading it before a change
Four buttons change what a row means: by login, by host, by program, or all three together. Start with login, because that is what a password rotation touches. Then switch to host. A single shared SQL login used by a connection pool looks like one person until the host view splits it into twelve application servers.

The grid also carries active days in the last 7 and 30, CPU, logical reads and writes, and the sampled wait. Select a row and the chart shows one cell per day, shaded by work, with a day of week by hour map underneath. That map is the part migration teams like. It shows the hours a consumer works, which tells you when a cutover will hurt that consumer least.
A few honest limits. First seen really means seen since at least the first day the history holds, so check the history start date in the headline. A database that only began to be monitored recently will show nobody as New. And lookup rows are never purged, but the samples are.
- Gone quiet rows are decommission candidates, but check the calendar first. A 31 day silence may just be a quarterly job.
- New rows are worth a conversation. Somebody started using this database recently and may not appear in any design document.
- Regular rows are your blast radius. Notify them before anything changes.
From census to decision
Export to CSV saves the census as shown. That file is the artifact a migration team can work from: every login, host and program with dates attached. It beats a spreadsheet assembled from hallway answers.
The same history store feeds other time based views. If you want the pattern behind concurrency trouble rather than who is connecting, Find Patterns in Your SQL Server Blocking History shows what the same hour by day idea reveals about blocking. The full reference for this report lives in the Who Uses This Database documentation.
The pattern we see is consistent. Teams that check ninety days of use before a change spend an afternoon. Teams that skip it spend a weekend.
What to check on your own server
- List the databases you plan to migrate, decommission or lock down this quarter
- Open the 90 day census for each one and group it by login, then by host, then by program
- Note the history start date in the headline before trusting any first seen value
- Check every Gone quiet row and every New row before you change a password or permission
- Export the census to CSV and hand it to the migration team
Try Database Health Monitor Today
Shows every login, host and program that used a database over the last 90 days, so a migration or decommission stops being a guess. Database Health Monitor shows it on every instance you connect, in the time it takes to open the report.
Download Database Health Monitor and run the Who Uses This Database report against your own server. There is nothing to configure first, and you will know inside a few minutes whether it tells you something you did not already know.