
Sooner or later every shop has a query that has been running for twenty minutes and a manager asking whether it is nearly done. On SQL Server the only place that can answer is sys.dm_exec_query_profiles, a DMV that holds a row count for every operator of every running plan. We see people find it, query it by hand, get back a wall of numbers, and quietly decide not to trust them. That instinct is a good one.
How can sys.dm_exec_query_profiles tell me how far through its plan a running query is? In SQL Server, sys.dm_exec_query_profiles is a DMV that reports the rows each operator of every running query plan has produced so far, per thread, while profiling is on. Against the optimizer's expected rows, they show how far through its plan a request is. That is an estimate, not a clock, and it exists only while profiling is enabled.
The numbers are real. They are also easy to misread, and a wrong reading costs something specific: a query killed at ninety percent, or one left to run for another hour because a total looked small. Database Health Monitor reads the same view and applies the corrections for you, and the rest of this post walks through what those corrections are, so you can judge any progress number against them, including your own.
In this post
- The columns everyone tries first
- What sys.dm_exec_query_profiles counts, and what it leaves out
- Traps when you query it by hand
- Turning row counts into a progress figure
- What the corrected reading tells you
- Before you act on it
The columns everyone tries first
Most people reach for percent_complete on sys.dm_exec_requests. It looks made for the job. It is not. SQL Server fills it in for backups, restores, DBCC commands and index rebuilds, and for an ordinary SELECT it stays at zero from start to finish, which reads exactly like a query that has not begun.
The next stop is a session list showing elapsed time, CPU and reads. All three are history. They say what the request has cost so far and nothing about what remains. Forty minutes and a million reads could be the last few seconds of a query or the first few minutes of one. The figures look the same either way.
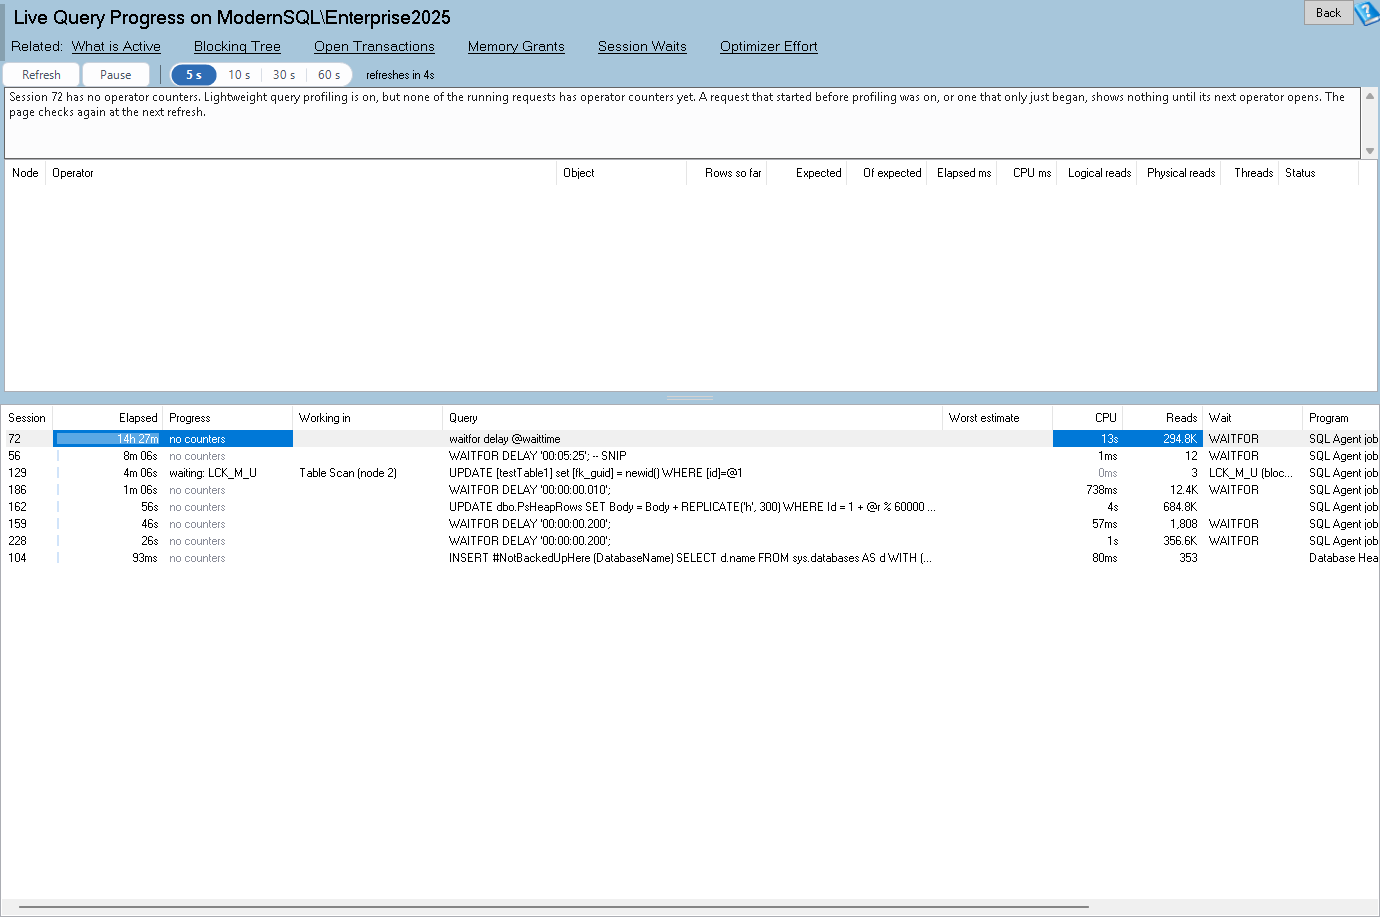
Live Query Progress is one of the reports in Database Health Monitor. It runs against your own servers, and it takes about a minute to have this same screen open on one of them.
What sys.dm_exec_query_profiles counts, and what it leaves out
The view counts rows. For each operator in a running plan, on each thread that touches it, it records how many rows have come out so far, next to the number the optimizer expected when it built the plan. Put the two side by side and you have the only honest progress measure SQL Server offers for a normal query: rows done against rows promised.
What it does not count matters more. It is not a timer, so it cannot say how many minutes remain. It does not hold the plan, so it cannot say which operators are expensive. And it has rows only while profiling is switched on for the request. When profiling is off there is simply nothing to read, and a hand written query returns an empty set that looks like an idle server.
Which version you run decides whether profiling is on at all:
| SQL Server | What decides whether rows appear |
|---|---|
| 2019 and later | Lightweight profiling is on by default; it can be turned off per database with the LIGHTWEIGHT_QUERY_PROFILING scoped setting |
| 2016 SP1 and 2017 | Trace flag 7412 must be on for the whole instance |
| 2014 | Only sessions that asked for statistics profiling with SET STATISTICS PROFILE ON or SET STATISTICS XML ON |
| 2012 and older | No usable source; the report says it needs 2014 or newer |
Two more limits catch people out. A request that started before profiling was enabled shows nothing until it finishes, so turning a switch on mid incident does not rescue the query you are staring at. And lightweight profiling counts rows only. The elapsed, CPU and read figures per operator stay blank unless the query was run with statistics XML on. If a column of zeros or blanks in your own query surprised you, this is usually why.
Traps when you query it by hand
The first trap is threads. A parallel plan reports a row per operator per thread, and the estimate is split the same way, with each thread carrying its own share. Compare one thread's rows with the whole estimate and an operator looks far behind when it is not. Compare the whole estimate with one thread's rows and the opposite happens. The ratio only means something after both sides have been summed across threads.
The second is the inner side of a nested loop. Its estimate already covers every pass the optimizer expected, so it must be set against the rows produced so far as they stand, not scaled again by the outer side. It also looks finished all the time. An inner side reaches the end of its input once for every outer row, so between two outer rows it appears closed when the join is nowhere near done. Treat it as closed only when the operator above it has closed too.
The third is small numbers. An operator expected to return ten rows that has returned two hundred is twenty times over, and it means nothing. Estimates on small row counts are noisy. The report flags an operator only once it has produced at least 1,000 rows, amber past ten times its estimate and red past a hundred times. A hand written filter with no floor will light up on trivia.
Then there is the plumbing. The view needs VIEW SERVER STATE, or VIEW SERVER PERFORMANCE STATE on SQL Server 2022 and later. Weighting progress needs the live plan, which is available from 2016 SP1, and the report falls back to a flat list of operators in node order when the plan is missing or larger than 2 MB. A refresh runs on its own connection and gives up after 45 seconds, so a stuck read never freezes the page. Background tasks and the tool's own queries are filtered out, otherwise they crowd the list.
Turning row counts into a progress figure
Raw counts do not add up to a percentage. The report takes only the leaves of the plan, the scans and seeks, because everything above them is fed by them. A closed leaf counts as complete. An open leaf counts as rows so far divided by expected rows, never above one. A leaf that has not started counts as nothing. Each leaf is then weighted by its own estimated cost from the live plan, so a scan carrying nine tenths of the plan's cost carries nine tenths of the answer. Without a plan, every leaf weighs the same.
Two decisions about honesty sit on top of that. Progress is capped at 99 percent, because a query that is still running is not done, whatever the arithmetic says. And when every leaf has used up its estimate while the request keeps going, the page stops showing a percentage and says past estimate, with the fill drawn full in the warning color. The finish time is unknown at that point. The plan assumed too few rows, and any number shown would be invented.
The report also separates a stalled request from a slow one, which a hand written query almost never does. Zero rows produced has several different causes:
| Shown | What it means |
|---|---|
| waiting | A lock or latch wait (LCK_M_, LATCH_, PAGELATCH_*) with no operator producing rows; the blocking session is named |
| waiting for memory | Queued on RESOURCE_SEMAPHORE for a memory grant; the query has not started, which is a different problem from running slowly |
| no counters | No rows in the view for this request, because profiling was off when it began |
| past estimate | Every leaf has exceeded its estimate and the query is still running |
PAGEIOLATCH_* waits are deliberately not treated as waiting. That is the disk doing its work, and the request is progressing. If the wait you meet is a log wait instead, our post WRITELOG Wait: Slow Storage or One-Row Commits? covers telling the two causes apart.
What the corrected reading tells you
Pick a request in the report and a plain sentence appears over the operator tree. It names the operator the request is working in, how much of that operator's estimate has been read, and the operator that has run furthest past what was expected. In the documentation's own example, a scan is thirteen percent through its estimate while a nested loop has already produced over eight thousand times its expected rows. Progress reads 58 percent, and the sentence reminds you that the figure is only as reliable as the estimates beneath it.
That is the useful part. A query with a mild worst estimate and a climbing fill is slow, and waiting is a reasonable call. A query that is past estimate with a red operator is not slow. It is wrong. The plan was built on a row count that reality has already disproved, and a longer wait will not fix it. The operator names the table, and the table points at the statistic that misled the optimizer.
The tree adds one more signal. A Threads column notes (skew) when a single thread produced more than 80 percent of an operator's rows, which explains a parallel query that is using many cores and still crawling. It sits next to a Status of open, closed or not started, so you can see where the plan is, not just that it is busy.
Before you act on it
Killing a session is on the right-click menu, and it asks first, naming the login, host, program, database and statement. It is enabled only for a login holding ALTER ANY CONNECTION. A kill that goes through is written to a log file with the time, the server, who was killed, the statement and how far through its plan the request was. That last detail is worth having when somebody asks the next morning why their report disappeared.
On a 2016 SP1 or 2017 instance the report also checks DBCC TRACESTATUS (7412, -1) to tell you whether the trace flag is on, and for a request with no counters it shows the script for your version. It copies the script and never runs it. That is deliberate. Enabling a trace flag instance wide is a decision for a person, and only requests that start afterward are covered.
To see the whole thing misbehave on purpose, the documentation describes a sample script that builds a small database with two tables whose statistics are frozen. The optimizer expects a one to one join of 60,000 rows and the join produces billions. Run it, open the page, and watch the join go red while the fill runs out of estimate. Full column and permission reference is in the Live Query Progress documentation.
None of this makes a progress number certain. It makes it honest about its limits, which is more than elapsed time ever was. Next time somebody asks how long a query has left, the better answer starts with rows against rows, and with an operator you can name.
What to check on your own server
- Check your SQL Server version, because live row counts need 2014 or newer and the plan tree needs 2016 SP1 or later
- Run DBCC TRACESTATUS (7412, -1) on a 2016 SP1 or 2017 instance to see whether lightweight profiling is switched on
- Check the LIGHTWEIGHT_QUERY_PROFILING database scoped setting on 2019 and later if a request shows no counters
- Compare rows so far with expected rows for each operator of your longest running request, summed across threads
- Look at the statistics behind the operator furthest over its estimate before you decide to kill the session
Try Database Health Monitor Today
Live Query Progress turns raw per operator row counts into a progress figure, the operator doing the work, and the estimate that went wrong, while the query is still running. Database Health Monitor shows it on every instance you connect, in the time it takes to open the report.
Download Database Health Monitor and run the Live Query Progress report against your own server. There is nothing to configure first, and you will know inside a few minutes whether it tells you something you did not already know.