
The overnight load job that finished in forty minutes last spring takes ninety now, and nobody touched the code. Reports that were instant all summer start hanging for eight or ten seconds every Monday morning, then clear up on their own by lunchtime. Task Manager says the server isn't even busy, and busy was never the same question as CPU pressure.
How do I know if my SQL Server has real CPU pressure? Real CPU pressure exists when sys.dm_os_schedulers shows tasks stuck in the runnable queue, meaning they are ready to run and are waiting only for a CPU, not when Task Manager shows a high percentage. A brief runnable queue is normal. One that persists across several schedulers, backed up by a signal wait ratio above 20 percent, is genuine CPU pressure.
Task Manager, and the perfmon counter behind it, average load across every core on the box. A four-core VM pinned at 100 percent and a sixty-four core server running three cores hot can report nearly the same percentage, and neither number says whether a query was ready to run and simply had nowhere to go. Database Health Monitor's SQL CPU Schedulers report exists because SQL Server already tracks the honest number: how many tasks, on each scheduler it owns, are waiting only for a CPU right now.
In this post
- What Counts as CPU Pressure on a Scheduler
- Reading the Core Wall
- One Node Hot, the Other Idle
- Plateau or Spike: Reading It Over Time
- From a Red Tile to a Root Cause
- What This Actually Costs
- How to Read It in Under a Minute
- What the Wall Usually Means
What Counts as CPU Pressure on a Scheduler
SQL Server doesn't hand work to Windows and wait its turn. It runs its own scheduler, one for every logical CPU, and each scheduler lets exactly one worker thread run at a time. Everything else with work to do sits in a queue attached to that scheduler. A task is runnable when it has everything it needs except the CPU itself: nothing blocking it, no lock to wait on, no disk read pending. A runnable queue that never clears is the plain definition of CPU pressure, and it's the one number this report is built to show, sampled live rather than caught once and trusted. Workers are the threads a scheduler creates on demand to actually run those tasks, and SQL Server keeps its own load factor for each scheduler, a measure it uses internally to decide where new work should land. None of that is exotic. It's data SQL Server has always kept about itself; the report just puts it on screen before anyone has to go looking for it.
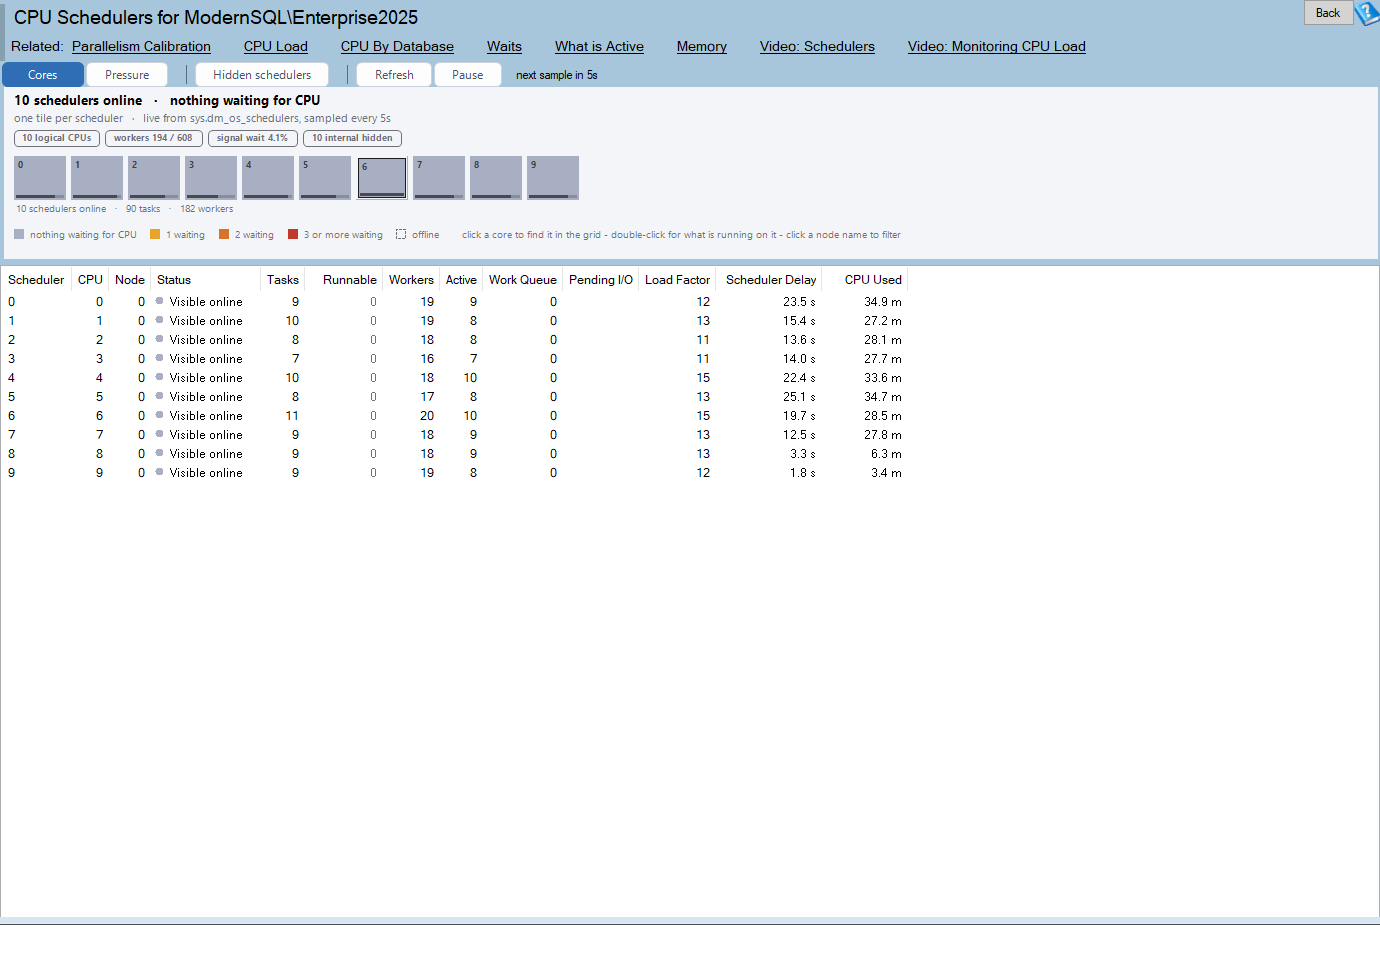
SQL CPU Schedulers is one of the reports in Database Health Monitor. It runs against your own servers, and it takes about a minute to have this same screen open on one of them.
Reading the Core Wall
Open the report and you get a wall of tiles, one for every scheduler SQL Server owns, arranged into blocks by NUMA node. Color comes from nothing but the runnable queue: slate for a scheduler with nothing waiting, amber for one task waiting, a deeper amber for two, red for three or more. An idle instance still carries a handful of background tasks on every scheduler, so there's no such thing as a 'busy' color here, only a 'waiting' one. That's deliberate. A scheduler can be carrying real work and still show slate, because the tile only answers one question: is anything stuck behind this CPU right now.
- Slate – nothing waiting for a CPU
- Amber – one task waiting
- Deep amber – two tasks waiting
- Red – three or more waiting
- Dashed outline – visible but offline, not currently in use

A full load bar under a slate tile is not a contradiction. It's the most common finding on a healthy busy server: the CPU is earning its keep and nothing is backed up behind it. The finding worth chasing is the opposite pairing, color with nothing underneath it, work piling up on a scheduler that isn't carrying much load at all, which usually means something is pinned to that one CPU rather than spread across all of them.
One Node Hot, the Other Idle
Grouping by node is not decoration. A server can average out fine across sixty-four schedulers and still be in real trouble on eight of them, if a workload, an affinity mask, or soft NUMA has pushed everything onto one node while its neighbor sits idle. That's not a CPU shortage, and buying more cores won't fix it. It's a placement problem, and the fix is in how work and threads are distributed, not in how many of them exist. Standard Edition adds its own version of this: it caps the cores SQL Server is licensed to use, and the schedulers for the rest are created anyway and left offline, dashed rather than colored. That surprises people who just paid for a bigger box and got the same wall back.
Plateau or Spike: Reading It Over Time
A runnable queue is an instantaneous reading of a counter that moves several times a second, so one sample of zero proves nothing and one sample of four proves nothing either. Switching from the wall of tiles to a stacked view of the same samples over time turns that noise into an answer: a plateau that holds for minutes is a real finding, a single tall spike almost never is. The signal wait percentage, how much of this instance's wait time is spent simply waiting in line for a CPU rather than waiting on a lock or a disk, corroborates it. Above roughly 20 percent across the whole instance, that number agrees with what the tiles are already showing.
Two names are worth knowing before this ever comes up. SOS_SCHEDULER_YIELD is the wait a query racks up while it keeps getting bumped back into the runnable queue instead of running to completion, and watching it climb in wait statistics is the same finding measured cumulatively rather than live. THREADPOOL is the one to actually worry about: it shows up when every worker thread is busy or blocked and a new connection can't get one, which from the outside looks like SQL Server refusing logins rather than running slowly.
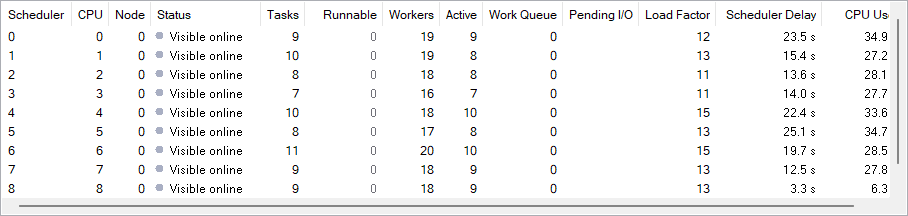
Everything on this page comes from sys.dm_os_schedulers and a couple of DMVs beside it, memory reads with no locks and no I/O, so there is no supported SQL Server version where it can't answer the core question. Two columns, scheduler delay and CPU used, are cumulative counters that only exist from SQL Server 2016 onward and are simply left off on anything older rather than shown as blanks. The one requirement that matters everywhere is VIEW SERVER STATE; without it, these DMVs return nothing at all.
From a Red Tile to a Root Cause
A colored tile only tells you a scheduler is under pressure, not what's causing it. Double-click it, and a pane opens listing every session currently attached to that scheduler: its state, how long it's been running, what it's waiting on. A request sitting there as runnable, waiting on nothing but the CPU, is confirmation that this is genuinely CPU pressure and not something else queued up behind it wearing the same symptom. From there the question stops being 'is the server short of CPU' and becomes 'whose query is this,' which is a much shorter conversation to have with a developer.
What This Actually Costs
We see this pattern across client environments that otherwise have nothing in common: retail, healthcare, logistics, a nightly batch shop and an OLTP system running thousands of short transactions a minute. Somebody watches the CPU percentage stay reasonable, rules out the hardware, and spends the next two days rewriting a query that was never the problem. Two days of a senior engineer's time chasing the wrong target isn't a rounding error on most budgets, and it gets spent whether or not the fix helps. The real cost isn't the CPU. It's those two days, and the outage that follows a few weeks later when worker threads finally run out and the instance stops accepting logins, which is a much worse Monday than a slow report. Catching a persistent runnable queue before it becomes THREADPOOL is the difference between a tuning conversation and an incident.
It's also the conversation that saves a purchase. A wall that's mostly slate with one hot node doesn't need more cores, it needs its affinity settings looked at. Buying a bigger server to fix a placement problem is an expensive way to find out it didn't help.
If the reason anyone is looking at this in the first place is that an alert fired, it's worth asking whether the alert deserved to fire at all. Why Your SQL Server Alert History Is Full of Noise covers the other half of that problem: getting paged for something that turns out to be nothing, often enough that the next real page gets ignored too.
How to Read It in Under a Minute
There's an order to this, and skipping ahead is how people end up staring at a red tile for twenty minutes when the notice band already named the problem. Start at the top and work down; every later step exists to confirm what the one before it suggested, not to replace it.
- Read the summary line and notice band first; a worker creation failure outranks everything else on the page
- Look at the color mix across the wall; slate everywhere is a busy server keeping up, not a problem
- Compare nodes against each other before comparing the whole instance against itself
- Switch to the pressure view and look for a plateau, not a spike
- Check the signal wait figure for corroboration
- Double-click the reddest tile and look for
SOS_SCHEDULER_YIELDon whatever is running there
What the Wall Usually Means
| What you see | What it usually means |
|---|---|
| Every tile slate, load bars full | A busy server that's keeping up; nothing to fix |
| One or two red tiles, the rest quiet | A single parallel query or a task pinned to one core |
| Every tile amber or red, every node | A genuine CPU shortage: more cores, less parallelism, or better queries |
| One node red, the other slate | An affinity or NUMA imbalance, not an overall shortage |
| Half the tiles dashed | An edition core limit or affinity mask, not a fault |
None of this requires guessing. The full reference for every column, chip and threshold on the page, including exactly what changes on SQL Server versions before 2016, lives in the SQL CPU Schedulers documentation.
What to check on your own server
- Query
sys.dm_os_schedulersand look for arunnable_tasks_countthat never returns to zero on any scheduler - Check
sys.dm_os_wait_statsfor a signal wait percentage above 20 percent across the instance - Compare scheduler load across NUMA nodes before assuming the whole instance is short of CPU
- Check for an affinity mask or an edition core limit before budgeting for more hardware
- Look for long blocking chains before worker count climbs toward
max_workers_count
Try Database Health Monitor Today
It replaces a guess about whether SQL Server is short of CPU with a live picture of every scheduler, so you stop staring at Task Manager and start watching the queue that actually matters. Database Health Monitor shows it on every instance you connect, in the time it takes to open the report.
Download Database Health Monitor and run the SQL CPU Schedulers report against your own server. There is nothing to configure first, and you will know inside a few minutes whether it tells you something you did not already know.
Related reading: Reading the SQL Server Error Log Before It Reads You. A companion piece on reading the SQL Server error log, covering archived files, failed login states and error 825, worth the click when an incident has already scrolled out of the current log.
Related reading: SQL Server Memory Usage: Where Did All the RAM Go?. This post follows server memory from the machine down to each database's cached pages, and explains which four numbers separate a healthy full server from one that is starving.