
A nightly import that has worked for years starts failing at 6 a.m. with a login error against a server nobody can name. Or an auditor asks which accounts on production can run code on another machine, and the room goes quiet. Across client environments we see the same pattern. SQL Server linked servers get created once, by someone who has since moved on, and then nobody looks at them again.
How do I audit SQL Server linked servers for dead links and security risk? To audit SQL Server linked servers, read sys.servers for the definitions and sys.linked_logins for who each one connects as, probe every link with sp_testlinkedserver, then look for RPC out enabled beside a catch-all login mapping to a privileged remote account. That combination lets any local login execute on the remote server.
The tool we use to look is the Linked Servers report in Database Health Monitor. It puts every definition, its identity mapping and its health on one page, and it does the expensive probing only when you ask. First, though, it is worth understanding why this corner of the instance stays dark for so long.
In this post
- Why SQL Server linked servers go unreviewed
- The check most people run first, and how it misleads
- Four questions, not one
- Six states, and why Not tested is the honest default
- Reading the four views
- The grid, and what to do with the answer
Why SQL Server linked servers go unreviewed
A linked server is a standing outbound trust with an identity attached. That sentence is the whole problem. It is a performance concern, because queries cross a network and a provider. It is also a security surface, because somebody decided which remote account those queries run as. Few other settings carry both burdens at once.
Yet nothing about it nags. A table does not grow. A job does not fail on a schedule. The definition just sits in a catalog view, and the only people who ever read it are the person who created it and, years later, the person who inherits the server and wonders what it does.
That is how we end up finding links to hosts that were decommissioned last spring, two definitions pointing at the same box under different credentials, and a handful of providers that Microsoft stopped supporting. None of it is dramatic. All of it is cost: time spent in an incident, or risk carried quietly until an audit or an attacker finds it.
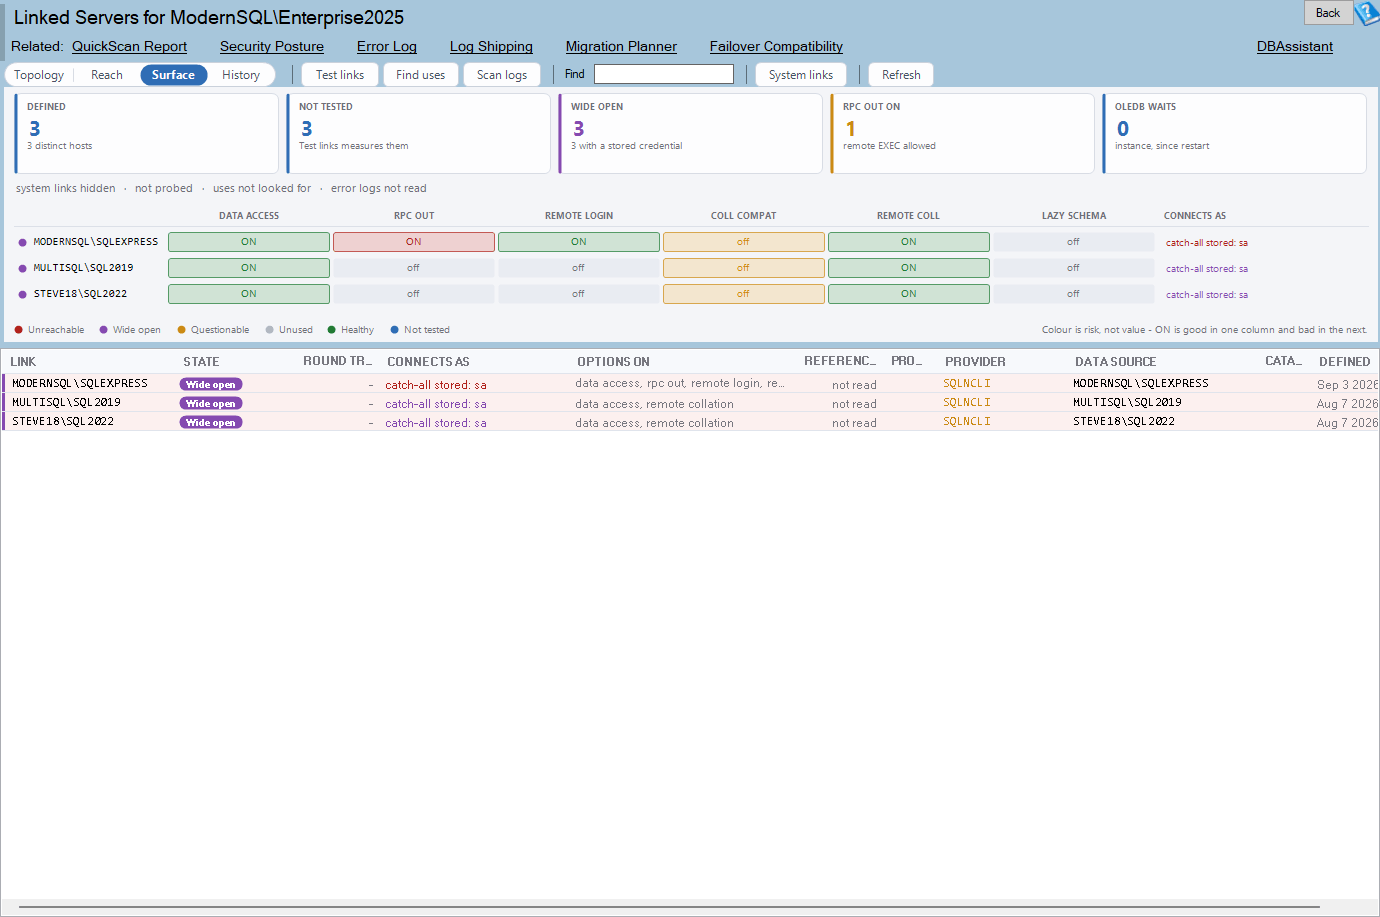
Linked Servers is one of the reports in Database Health Monitor. It runs against your own servers, and it takes about a minute to have this same screen open on one of them.
The check most people run first, and how it misleads
The usual move is to run a query against sys.servers, scroll the result, and conclude that the list looks reasonable. We have done it ourselves. The trouble is that this view only tells you what was configured. It says nothing about what works.
Take the modify date, for instance. It feels like evidence. A link edited in 2017 that has worked perfectly ever since and a link edited in 2017 whose target host vanished last spring carry identical values. The date records the last edit and nothing else. It is the least useful timestamp on the whole page, and the report puts it in the last column for exactly that reason.
The second misleading habit is sorting by name. Two links to the same host under different credentials sit next to each other by accident, identical in every column that matters. Nothing in the grid tells you they are the same box. You can stare at the rows for a long time and see two unrelated entries.
The third is stopping at sys.servers and never joining to sys.linked_logins. The definition says where a link goes. The login mapping says who it goes as. Without the second table you cannot answer the question an auditor will ask.
Four questions, not one
A linked server gets asked four different questions, and no single listing answers more than one of them. So the honest approach is to measure four things separately.
| Question | What answers it |
|---|---|
| What is out there? | The definitions, grouped by the host they point at |
| Does it answer, and how fast? | A live probe, measured against that link's own timeout |
| What is switched on, and who does it connect as? | The option flags plus the login mappings |
| Has it been failing? | Every retained error log, not just the current one |
Notice that only one of those is a pure read of configuration. The others require reaching out, searching or scanning, and each is slow in its own way. That matters because a report that hangs for half a minute when it opens teaches people to stop opening it.
So the report loads the cheap part, the definitions and mappings, and nothing else. Probing a remote host, searching every database for four part names and reading the error logs each sit behind their own button, and each tells you what it cost. The probe is also capped at 10 seconds per link. A dead host should cost you ten seconds, not the thirty a link with a connect_timeout of 0 would burn before SQL Server gave up.
Nothing on the page changes a linked server. Every action reads or copies. That is worth saying out loud, because many DBAs will not run anything near a production trust unless they are sure of it.
Six states, and why Not tested is the honest default
Every link lands in exactly one state, and the worst thing about it decides which.
| State | What it means |
|---|---|
| Not tested | Nobody has probed it yet |
| Healthy | It answered and nothing about the definition stands out |
| Unreachable | Probed, and it did not answer |
| Wide open | It answers, and anyone on this instance can use it to execute on the remote server |
| Questionable | Deprecated provider, duplicate definition, data access off, or lazy schema validation |
| Unused | Nothing on this instance refers to it |
The first state is the one people misread. When you open the page, every link says Not tested. That is not a fault. It is the report refusing to claim a link works until something has actually asked it. A dashboard that painted everything green on load would be lying to you, and we would rather ship a page that starts out modest.
Wide open deserves a second look. It is the state where a link works and the permissions behind it are broader than anyone intended. Pair it with the Unused state and you have the worst combination on the screen: a link that nothing on the instance needs, which everything on the instance can execute through.
Reading the four views
Topology: one node per host
The first view is a hub and spokes diagram, and its one structural decision is that a node is a host rather than a definition. Two links aimed at the same data source collapse into a single node badged with a count of definitions. That badge is how people discover they have been maintaining two links to one box for two years. Often one is the link everything uses and the other is a forgotten experiment with a privileged account behind it.
Spokes you have not probed are dashed and all the same length, and the legend says they are unmeasured. A spoke whose length hinted at a latency nobody measured would be a small lie, and the chart avoids it.
Reach: against each link's own allowance
Once you press Test links, the report runs sp_testlinkedserver and a round trip through the provider for every link. The Reach view then draws bullet lanes on a shared log axis. The clever part is the denominator. Each trip is measured against that link's own connect_timeout, because somebody chose that allowance deliberately.

Dividing by the link's own timeout makes a 12 ms replication hop and an 88 ms warehouse call comparable. And a link that fails does not get a longer bar. It gets a wall at the point where it stopped. A 30 second bar and a 30 second timeout are different facts, and the chart refuses to blur them.
Surface: the matrix that finds the lateral path
The third view is a matrix of switches and identities. It is a matrix because the subject is a set of booleans across a set of rows, with no magnitude to draw. Color encodes risk rather than value, so ON is green under Data access and red under RPC out. One lets a query read. The other lets a caller execute.
The row this view exists to find is RPC out enabled together with a catch-all mapping to a privileged remote account. A catch-all mapping is the row in sys.linked_logins whose local principal is 0. It applies to every login on the instance that has no mapping of its own. Attach a stored remote credential and every one of those logins inherits it.
That is a lateral movement path, and it is invisible on any page that prints sys.servers and stops. When the report finds it, it says so in plain words, along the lines of: every login here can execute remotely as the stored account.
History: one lane per link, across every retained log
The last view answers the intermittent question. It draws one lane per linked server across every retained error log, not only the current one. Vertical alignment means one event. A lane that is sparse and then solid from a given date says the provider broke that day. A column of ticks across three lanes inside the same four minutes is one directory outage, not three separate problems.
There are limits, and the report states them. The scan reads up to 8 retained logs and keeps up to 20,000 matched lines per log. If anything went unread, a notice band says so, because a cap nobody mentions reads as completeness. Double-click a tick and the entry opens in the Error Log report. If you are new to that side of things, our piece on Reading the SQL Server Error Log Before It Reads You covers why those archives deserve attention.
The grid, and what to do with the answer
Beneath the views sits a grid with eleven columns. The one we reach for first is Connects As, which shows the login mapping in words instead of ids. That is where a catch-all mapping to a stored credential stops being an abstraction.

References stays empty until you press Find uses. That button searches every database for four part names and reads the plan cache, so it is slow and worth running deliberately. A link with no references is a candidate for removal. A link with many is a change you cannot make casually.
Be careful with the Unused label, though. The search covers this instance only. An application that builds its own four part name inside a string, or a link used only from another server, will not show up. Treat Unused as a question to ask the owner, not a verdict to act on.
In our experience the same handful of patterns turn up, and each has a sensible reading:
- Every link Unreachable at once. Not the links. Look at networking, DNS or the service account, then check History for whether they all stopped on the same day.
- A deprecated provider on a link that works.
SQLOLEDBand SQL Native Client are out of support andMSOLEDBSQLreplaces them. It works until the provider is missing on a rebuilt server. Plan it, do not panic about it. - Data access off. Either the link exists for RPC only, on purpose, or somebody switched it off and never learned why the queries started failing.
- Wide open with zero references. The worst row on the page. Fix it first.
- The Jet or ACE provider. Those reach a file, not a server, which is rarely what the name suggests.
A sensible order of work is the one the report itself suggests. Check Topology and count nodes against definitions. Press Test links. Read the Unreachable ones. Move to Surface and hunt for RPC out beside a catch-all mapping. Then press Find uses, and bring in History only when something intermittent is suspected.
Linked servers also belong in the wider security picture. If you want to see how a single failing item can hide inside an overall number, our post Is Your SQL Server Security Score Hiding a Critical Fail? makes that case for the Security report, which sits next to this one. For the full column and setting reference, the Linked Servers documentation has everything.
One last note on cost. If the instance has no linked servers, the report says so, and that is a good result: one fewer standing outbound trust to defend. On Azure SQL Database the feature does not exist, so there is nothing to show. Either way, the answer takes minutes, and the alternative is learning about a forgotten trust the hard way.
What to check on your own server
- Count the rows in sys.servers where is_linked is set and compare that to the number of distinct data sources
- Run sp_testlinkedserver against each link and write down which ones fail
- Query sys.linked_logins for rows with a local principal of 0 and note any that store a remote credential
- Check whether RPC out is enabled on any link that also has a catch-all mapping
- Search database code and the plan cache for four part names before you remove any link
Try Database Health Monitor Today
It shows which linked servers still answer, which are duplicates or unused, and which let every login on the instance execute on a remote server. Database Health Monitor shows it on every instance you connect, in the time it takes to open the report.
Download Database Health Monitor and run the Linked Servers report against your own server. There is nothing to configure first, and you will know inside a few minutes whether it tells you something you did not already know.
Related reading: WRITELOG Wait: Slow Storage or One-Row Commits?. A companion piece on transaction log write pressure, showing how to tell slow storage from one-row commits and which databases and statements are actually writing the log.