A stored procedure that ran in under a second in June and four seconds by August, with the query plan looking exactly the same either way, is one of the most familiar tickets a consulting practice sees. Row counts are up a little, never enough to explain a fourfold jump. Somebody adds an index, waits a week, and CPU barely moves. Almost nobody suspects the small scalar function three calls deep, the one doing a date calculation on every row, that has never once been a candidate for SQL Server scalar UDF inlining.
What is SQL Server scalar UDF inlining, and why isn’t it happening for my functions? SQL Server scalar UDF inlining is a SQL Server 2019 optimizer feature that folds a scalar function’s logic directly into the calling query instead of running it as a separate call per row. It needs database compatibility level 150 or higher and the TSQL_SCALAR_UDF_INLINING scoped configuration set to ON, plus a function written within a specific set of T-SQL rules.
In this post
- What SQL Server Scalar UDF Inlining Changes
- Why sys.dm_exec_function_stats Goes Quiet for Two Different Reasons
- What the Report Actually Puts on the Screen
- Eleven Reasons SQL Server Refuses to Inline a Function
- Reading the Grid: Cost, Callers, and the Ones Nothing Calls
- The Cost of Turning It On
- What the Shape of the Matrix Tells You
- How to Use What You Find
What SQL Server Scalar UDF Inlining Changes
Scalar functions have always been the part of a T-SQL codebase nobody budgets time for. They read like an ordinary function call, get unit tested once, and then sit inside a stored procedure firing once per row without anyone tracking what that costs. SQL Server 2019 gave the optimizer a way to fix a lot of that automatically, by rewriting an eligible function’s logic directly into the surrounding query instead of executing it as a separate call for every row. Microsoft’s internal name for the underlying research was Froid, and the public switch is a database scoped configuration called ‘TSQL_SCALAR_UDF_INLINING’, sitting behind a compatibility level of 150 or higher. Turn both on and the qualifying functions stop behaving like function calls at all. This is the part the engine keeps to itself. Not every function qualifies, and it will not say why one doesn’t unless somebody goes looking.
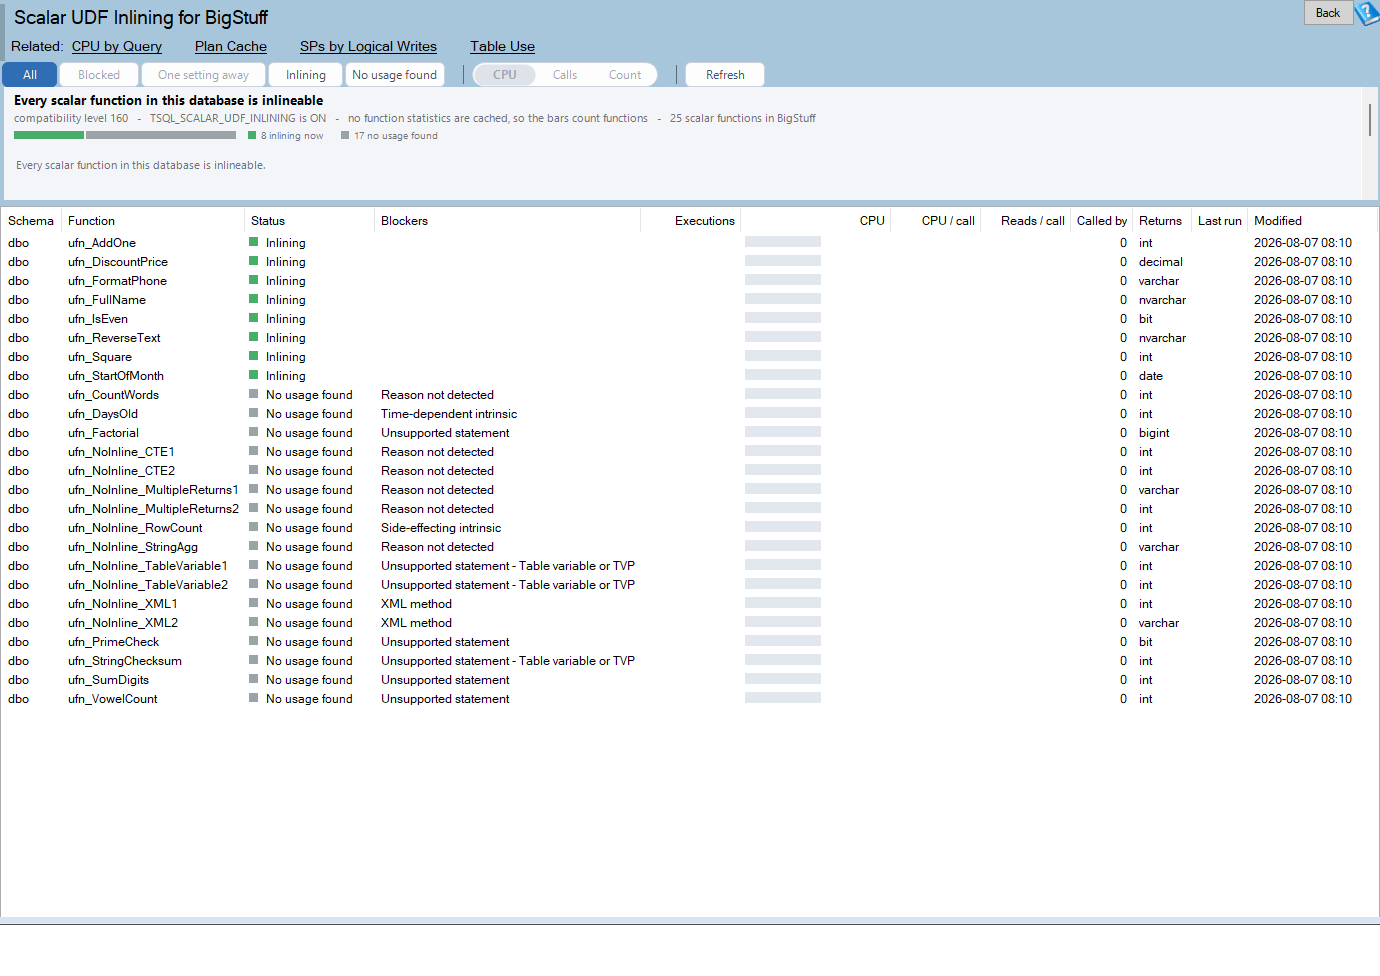
Scalar UDF Inlining is one of the reports in Database Health Monitor. It runs against your own servers, and it takes about a minute to have this same screen open on one of them.
Why sys.dm_exec_function_stats Goes Quiet for Two Different Reasons
The obvious way to hunt this down is to go straight to ‘sys.dm_exec_function_stats’ and look for the expensive functions. That works right up until it doesn’t: a function with nothing there might be the best news on the page, or it might be dead code nobody has called in years, and the raw numbers can’t tell you which. A function that’s inlining correctly stops generating rows in that DMV, because there’s no longer a separate function call to count. A function nobody has ever run does exactly the same thing, for the opposite reason. Read the DMV on its own and a silent success looks identical to an unused dead end. That’s the trap in chasing CPU by query or top procedures first. The number moves when a function starts inlining, and it moves the same way when the function simply stops being called, and a query plan alone won’t say which happened. If you’ve already worked through SQL Server Waits by Query: Find What’s Actually Slow and the top offender still doesn’t add up, a scalar function hidden a few calls deep inside that procedure is a common reason the visible cost and the real cost disagree.
What the Report Actually Puts on the Screen
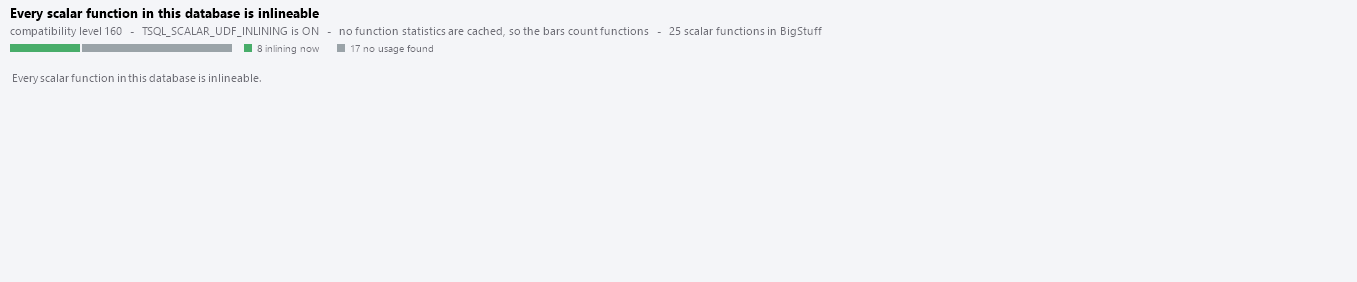
What actually settles the question is a single bit, ‘is_inlineable’, sitting in ‘sys.sql_modules’. SQL Server computes it once per function and never explains it, so it has to be paired with something that reads the module text and works out the reason on its own. The report checks every scalar function in a database against that bit, and for the ones that are blocked, scans the definition for which of eleven known rules it’s breaking. Reading that module text needs ‘VIEW DEFINITION’ on the functions; without it, a blocked function falls through to a Reason not detected row instead of a real answer. Reading the cost numbers needs ‘VIEW SERVER STATE’ on the instance; without it, every cost column comes back empty and the chart counts functions instead of CPU. The result isn’t a ranked list. Every other chart in the product puts the worst object first: worst table, worst index. This one doesn’t, because a single edit here often fixes several functions at once. Pull ‘GETDATE()’ out of five functions that all share that habit, and all five start inlining on the next call. So the chart draws a matrix instead: one row per blocking reason, one column per distinct combination of reasons actually present in the database, sized by what each combination is still costing. A strip above it splits every function in the database into four bands, inlining, one setting away, blocked, and no usage found, so nothing falls out of the count even though the matrix below only draws two of those four.
Eleven Reasons SQL Server Refuses to Inline a Function
Some of these are catalog fact, read straight off ‘sys.sql_modules’ and ‘sys.parameters’: whether the function is natively compiled, whether it calls itself, whether it’s declared EXECUTE AS anything other than CALLER, whether a parameter or the return value is a user-defined type. The rest come from reading the function body itself, with comments and string literals blanked out first so a comment mentioning GETDATE() doesn’t get treated as a real call to it, and matching done on word boundaries so a column literally named GETDATE doesn’t get flagged for sharing a name with the intrinsic. An intrinsic also has to be followed by an opening bracket to count at all, so a bare variable or column reference is left alone.
| Blocker | What fixes it |
|---|---|
| Time-dependent intrinsic | Pass the time in as a parameter rather than reading the clock inside the function |
| Side-effecting intrinsic | Move anything that can’t be safely replayed out to the calling code |
| Unsupported statement | Rework loops as set-based logic, or switch to an inline table-valued function called with CROSS APPLY |
| Table variable or TVP | Replace the table variable with a join or an EXISTS check |
| Variable accumulation | Use STRING_AGG or a windowed aggregate at the call site instead of accumulating row by row |
| XML method | Shred the XML outside the function, at the call site |
| EXECUTE AS not CALLER | Switch to EXECUTE AS CALLER and handle permissions elsewhere |
| User-defined type | Use the underlying base type instead of the user-defined type |
| Natively compiled | Nothing to fix; these are already compiled and inlining doesn’t apply |
| Recursive | Nothing to fix; a function that calls itself has nothing finite to inline |
| Reason not detected | Open the definition and compare it against the inlining rules by hand |
Time-dependent intrinsic shows up constantly. GETDATE() inside a scalar function is close to a reflex, and moving it to a parameter is usually the cheapest fix on the whole page.
Double-clicking any row opens the module text itself, with the verdict and every blocker written across the top as comments, which is more than SQL Server Management Studio hands you by default. A function created WITH ENCRYPTION can’t be read that way at all, and the window says so rather than showing an empty box. An encrypted function that refuses to inline lands in Reason not detected for exactly that reason, and it’s the honest answer rather than a guess.
Reading the Grid: Cost, Callers, and the Ones Nothing Calls
The grid underneath lists every function with its verdict, every blocker it carries, and what it’s costing: calls, CPU, CPU per call, reads per call, and how many other modules in the database reference it. It sorts blocked functions first, since that’s the only band where a decision is actually needed, then by cost, then by caller count. Called by only counts modules inside this database; a recursive function referencing itself is taken back out of its own count, since a function calling itself is not really another caller. No usage found is its own band, gray rather than green, and deliberately not labeled unused. It only means two searches came back empty: nothing in the plan cache has executed it, and nothing else in the database’s module text references it. Application code calling it directly wouldn’t show up in either search, because SQL Server doesn’t record that anywhere. A function landing in that band is worth a look through the application codebase before anyone decides to drop it.

The Cost of Turning It On
Getting a function inlined usually needs two switches, not one. The database scoped configuration is small and reversible in a single statement. The compatibility level isn’t: raising it to 150 changes the cardinality estimator and every optimizer behavior gated behind that level, which means it replans the entire database, not just the functions being fixed. That’s worth a Query Store baseline and a planned regression window before anyone flips it, not something to do on a Friday afternoon.
The escape hatch runs per function rather than per database. WITH INLINE = OFF turns inlining off for one function without touching the setting for anyone else, so a single query that regresses after the switch doesn’t have to cost the whole database the feature.
A rewrite is a code review. A compatibility level change is a database-wide bet, and it earns a baseline to prove it paid off.
What the Shape of the Matrix Tells You
- A tall green column with nothing else: every function already qualifies and none of them are being inlined, a setting to flip rather than a project
- One row stretching across most of the columns: a single habit spread through the codebase, usually a GETDATE() call, and a batch of near-identical edits
- A short column with a large bar: one or two functions carrying an unusual combination but called constantly, worth fixing on its own merits
- A tall column with a small bar: a lot of functions, barely called, real work for little payoff, worth coming back to later
- A zone strip that’s mostly gray: a lot of code nothing appears to call, worth checking against the application layer before anyone touches it
How to Use What You Find
Start at the top of the page, not the matrix. If nothing in the database is inlining yet, the blocker discussion is premature, because it’s a switch problem, not eleven separate code problems. Once that’s confirmed on, the pinned green column is the free win: no rewrite required, no risk. After that, take the heaviest column to its right, since it’s sorted to be worth the most, and hover the row that spans the widest range of columns to see whether fixing one habit clears several functions at once.
Across a lot of environments, that last step is where the real return sits. A handful of scalar functions all calling GETDATE() internally is such a common pattern that finding and fixing it is often less work than the meeting it takes to schedule the change window for raising a compatibility level in the first place.
None of this needs a maintenance window to start. Working out which ten functions are worth a rewrite this quarter, instead of guessing, is most of the value by itself, well before anyone touches a compatibility level.
What to check on your own server
- Check whether the database is at compatibility level 150 or higher and TSQL_SCALAR_UDF_INLINING is set to ON
- Query sys.sql_modules for is_inlineable across your scalar functions to see how many already qualify
- Search function definitions for GETDATE() and similar intrinsics, the single commonest blocker
- Capture a Query Store baseline before raising the compatibility level, since it replans every query in the database
- Turn inlining off for a single function with WITH INLINE = OFF if a rewrite regresses after the change
Try Database Health Monitor Today
It shows exactly which scalar functions SQL Server refuses to inline, what they have in common, and which single edit would fix the most of them at once. Database Health Monitor shows it on every instance you connect, in the time it takes to open the report.
Download Database Health Monitor and run the Scalar UDF Inlining report against your own server. There is nothing to configure first, and you will know inside a few minutes whether it tells you something you did not already know.