
A maintenance job that used to finish before the overnight backup now spills into the morning. A query that ran fine for a year times out on an ordinary Tuesday, and nobody touched the query. Someone eventually asks about SQL Server index health, and the search for what changed starts with no obvious place to look.
How do I check SQL Server index health without guessing? SQL Server index health is best measured with a single score that lists its own reasons, not with fragmentation percentage alone. A trustworthy score rolls up missing, duplicate, unused, inefficient, and problem indexes, heaps, wide clustering keys, and stale statistics into one place, so you know which of those ten problems to fix first.
Database Health Monitor's Indexing Overview page starts from a different question than fragmentation percentage alone. The usual first move for a slow query or a bloated backup is a fragmentation check, followed by rebuilding whatever comes back over 30 percent. That number feels precise, and it is often the wrong one to chase: a badly fragmented index nobody queries costs nothing, while a lightly fragmented one that every query touches might be costing plenty. The Indexing Overview page asks how healthy this database's indexing is as a whole, and why.
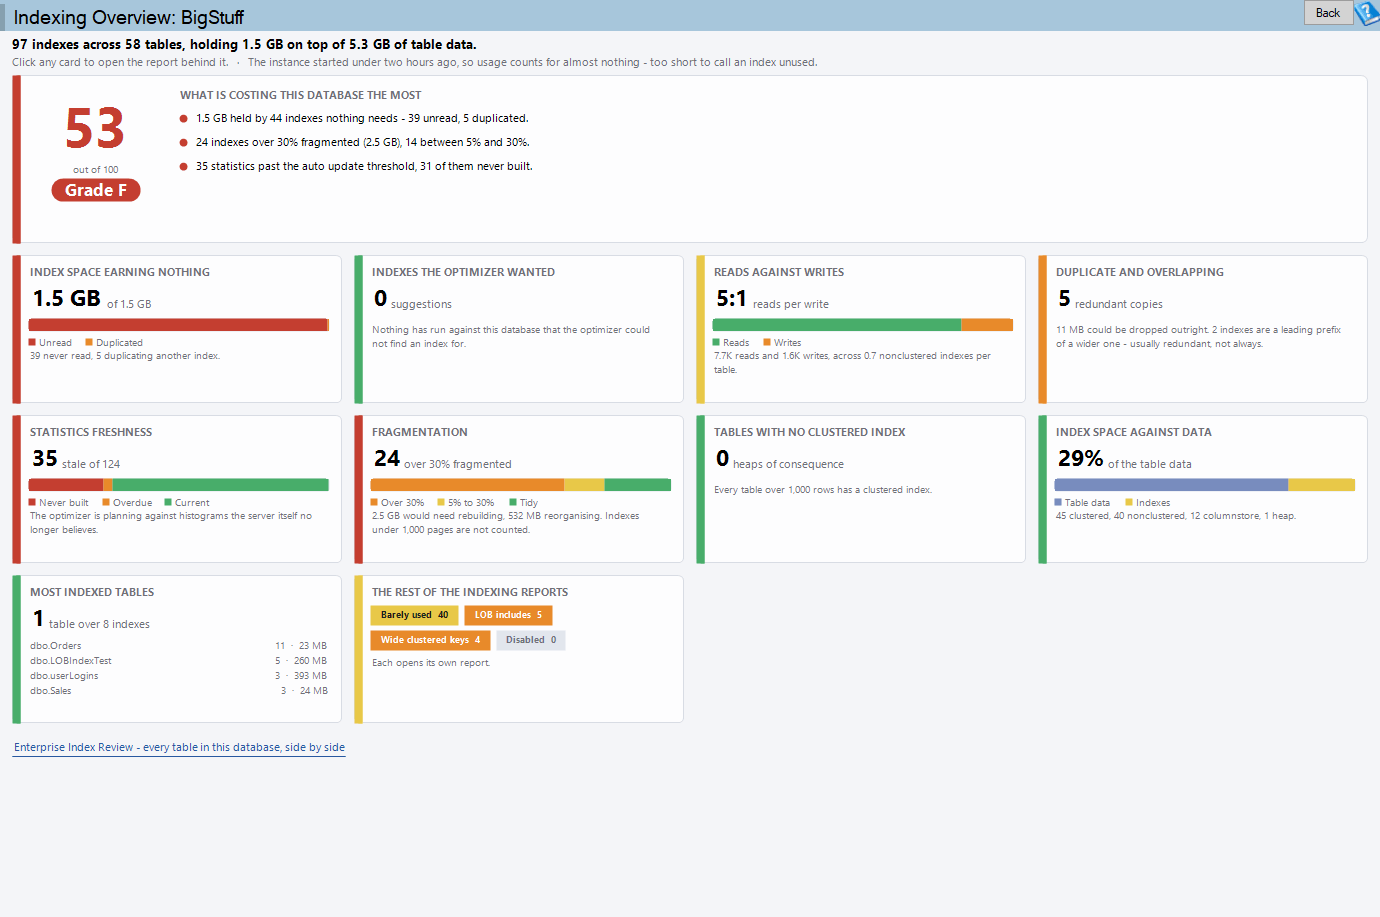
Indexing Overview is one of the reports in Database Health Monitor. It runs against your own servers, and it takes about a minute to have this same screen open on one of them.
The score at the top is not a single mystery number. It comes with the reasons behind it, so a low score points straight at which cards below deserve attention instead of leaving you to guess. Below it sits a row of cards, one for each indexing report underneath this page, each showing a count, a size, or a verdict, and clicking any one of them opens that report.
What a SQL Server Index Health Score Actually Weighs
This page did not always cover that much ground. Earlier versions showed two bar charts of unused and duplicate index counts, an empty strip that had nothing wired up to fill it, and one link out to a separate report. Eleven indexing reports sat underneath the page the whole time; the page's own overview only tracked two of them. The current score and its card row are what closing that gap looks like.
The Ten Reports Behind the Cards
| Report | What it finds |
|---|---|
| Missing Indexes | Indexes SQL Server's optimizer would like to see, weighed against the write cost of adding them |
| Unused Indexes | Indexes nobody reads, ranked by how much space you would get back |
| Duplicate Indexes | Two or more indexes with the same keys, includes, and filter |
| Inefficient Indexes | Indexes written to far more often than they are ever read |
| Most Used Indexes | The indexes you should leave alone |
| Problem Indexes | Disabled, hypothetical, or set with a low fill factor |
| Unclustered Tables | Heaps, and whether that is actually a problem here |
| Big Clustered Indexes | Wide clustering keys and what that width is costing you |
| Index Fragmentation | Fragmentation alongside page density |
| Statistics | Whether the optimizer's estimates are still current |
Not every card is populated the moment the page opens. Each one fills in as its own background pass finishes, so the page is useful within seconds rather than making you wait for the slowest report to complete. A card still spinning is working, not broken.
Where to Start When Every Card Has Something in It
Start with the reasons behind the score; they point at which cards matter today. From there, the cheapest fixes come first: hypothetical indexes waiting in Problem Indexes and safe overlaps waiting in Duplicate Indexes take minutes to clear. The real trade-offs come next, weighing what Missing Indexes wants against what Unused Indexes would let you drop, since one can pay for the other. Heaps and wide clustering keys come last, because those are structural projects, not quick fixes.
Table Use sits alongside these ten as a related report, worth a look if a table shows up everywhere and you are not sure it is read at all. The full reference for the Indexing Overview page walks through every card and every FAQ in more detail.
Try Database Health Monitor Today
Instead of opening ten separate indexing reports one at a time, you get a single score that already tells you which one to check first. Database Health Monitor shows it on every instance you connect, in the time it takes to open the report.
Download Database Health Monitor and run the Indexing Overview report against your own server. There is nothing to configure first, and you will know inside a few minutes whether it tells you something you did not already know.
Related reading: What Is in Master, and What a Rebuild Would Lose. A companion piece lists everything hiding inside SQL Server's master database, credentials, linked server logins, triggers and startup procedures included, so a rebuild never comes as a surprise.