
Across enough consulting engagements, a pattern shows up on nearly every Reporting Services deployment: ReportServer database size doesn't grow the way anyone expects. It sits quiet for months, then someone gets paged because a drive alarm fired, and by the time anybody looks, the database has crept from two gigabytes to fourteen with nothing that looks like a new report in sight.
Why does ReportServer database size keep growing when nothing about the reports changed? ReportServer database size usually grows from what a report server writes about its own work, not from report definitions: stored renderings, open sessions, and delivery history. Trimming old rows frees space inside a table without shrinking the file, so the real fix is ranking every table by reserved space rather than watching the total.
The first instinct is to blame the report catalog: too many report definitions, too many data sets, years of clutter nobody archived. That is rarely it. A report definition is a few kilobytes of XML; a hundred of them would not move the needle. Database Health Monitor's SSRS What Fills This Database report exists because the honest answer is almost always what a report server writes about its own work, not what it was built to hold.
None of this is cheap to get wrong. An afternoon spent shrinking files and restarting services is time not spent on anything else, and it teaches nothing for the next time the drive fills up. The servers we see handle this well are the ones where somebody looked at which tables were actually growing, once, and kept looking.
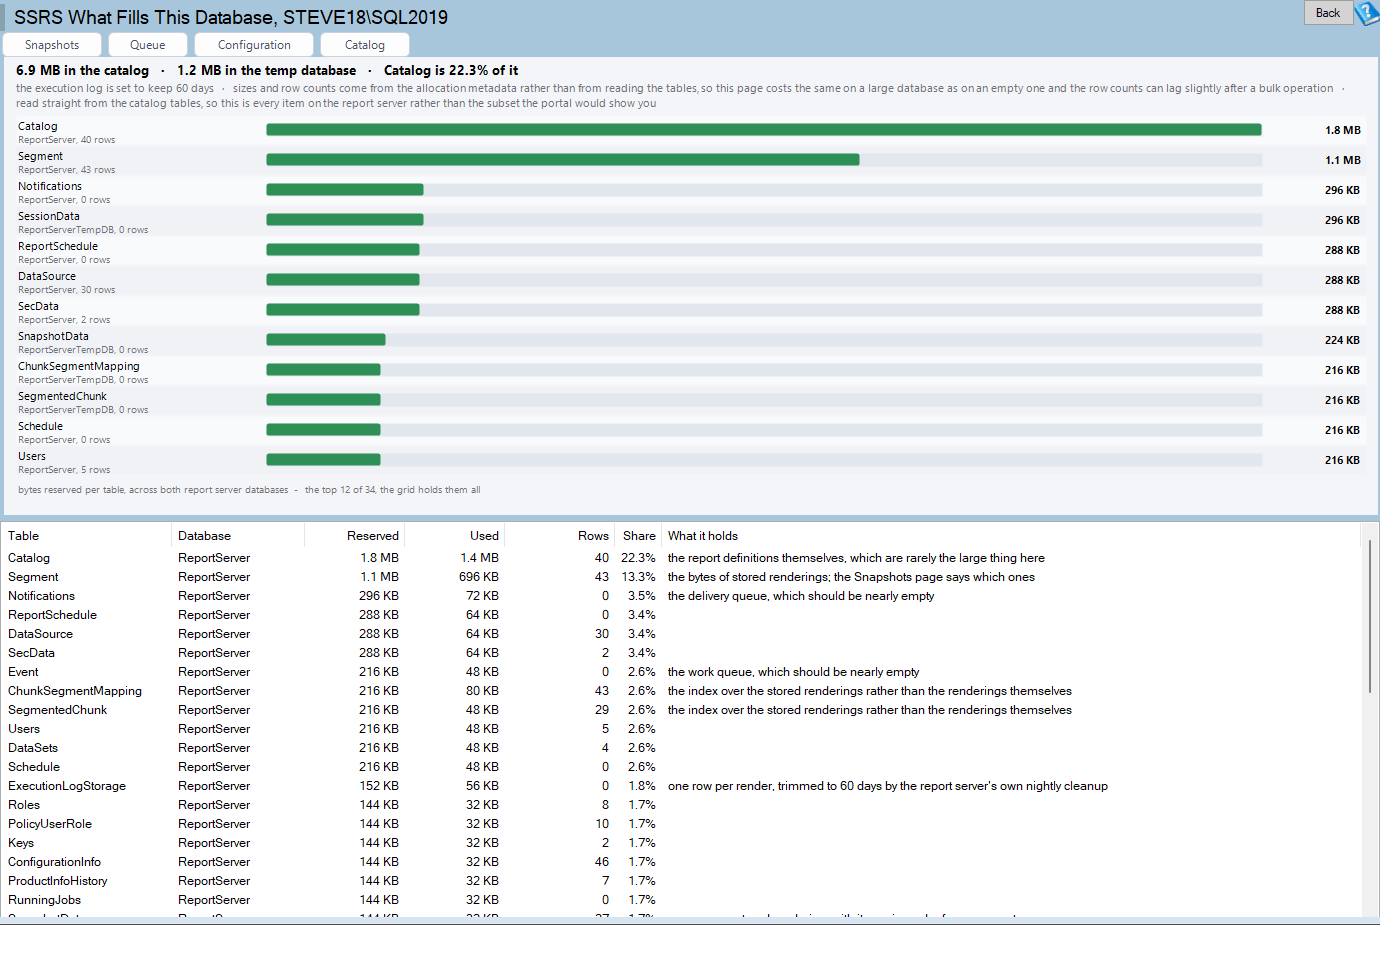
SSRS What Fills This Database is one of the reports in Database Health Monitor. It runs against your own servers, and it takes about a minute to have this same screen open on one of them.
Why the Report Catalog Is Rarely the Culprit
Shrinking the data file is the usual next move, and it buys nothing lasting. SQL Server hands back only what is genuinely empty, and the very next execution log entry or stored rendering fills the gap right back in. Restarting the report server service does not help either. The growth is not a leak; it is the service doing exactly what it was built to do, more of it than anyone budgeted for.
What actually earns an answer is not the database's total size but which tables inside it are reserving that space, and how much of what they reserve is even in use. SQL Server already tracks this for every table, in sys.tables, sys.indexes, sys.partitions and sys.allocation_units, without reading a single row of data. That makes it cheap to ask on a catalog that has been running for a decade.
What Actually Drives ReportServer Database Size
A report server catalog is really two databases working together. There is the catalog itself, and a companion temp database whose name is just the catalog's own with TempDB tacked onto the end. The second one holds session data for every open report, and it is routinely the bigger of the pair, especially on a busy server.
Inside both databases, a short list of tables tends to explain almost everything. Segment, along with the index tables that sit over it, holds the actual bytes of stored renderings. SessionData holds one row per open report session. ExecutionLogStorage holds one row per render, and it only shrinks when the server's own nightly cleanup catches up with whatever retention period it was given. Event and Notifications are work and delivery queues, and either one holding much more than a token number of rows is a sign the report server has stopped keeping up with itself.
SubscriptionHistory is a different kind of large: it is a record of delivery attempts, trimmed to each subscription's most recent ones, so a big one usually means many subscriptions or long delivery messages rather than a backlog. PersistedStream holds rendered output kept around for a session. And Catalog, the table that actually holds the report definitions everyone blamed first, is almost never the large one. That is the guess this report exists to correct.
Reading the Storage Chart
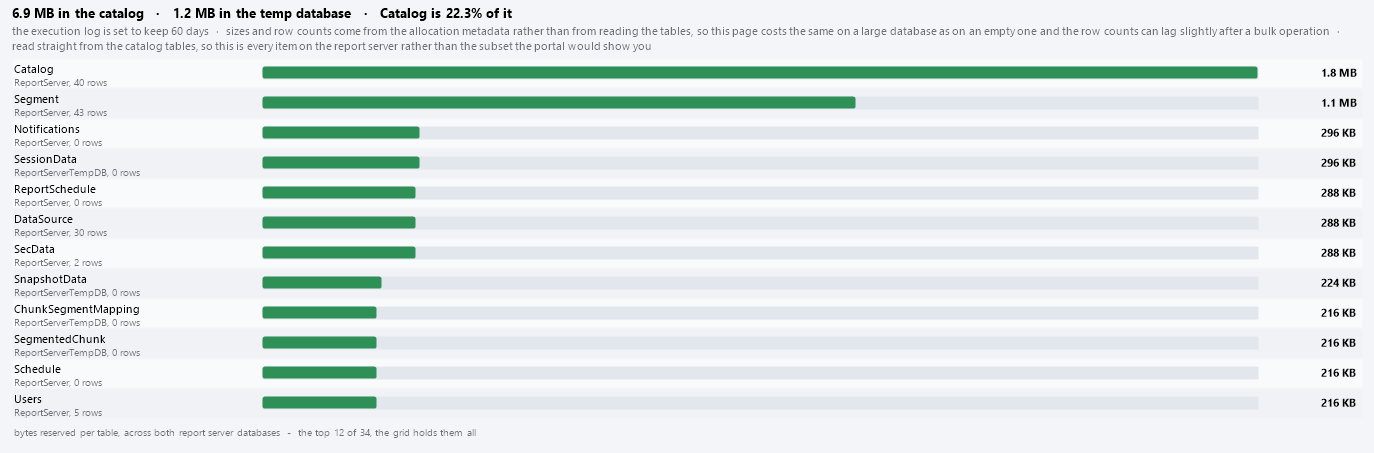
The chart draws one bar per table that has reserved any space, largest first, across both databases, so the shape of the problem is visible before a single number gets read. Color does the flagging.
| Color | Meaning |
|---|---|
| Red | Event or Notifications holding more than 1,000 rows, or SubscriptionHistory reserving over 100 MB |
| Amber | A table reserving more than 50 MB while using less than half of it |
| Green | Everything else |
Why a Trimmed Execution Log Doesn't Shrink Anything
This is where the shrink-the-file instinct from earlier gets its answer. Reserved space and used space are two different numbers, and the gap between them is exactly what a large delete leaves behind: freed inside the table, not returned to the file. A report server that dutifully trims its execution log every night can still show the same reserved size a year later, because the table just reuses that freed space as it fills back in.
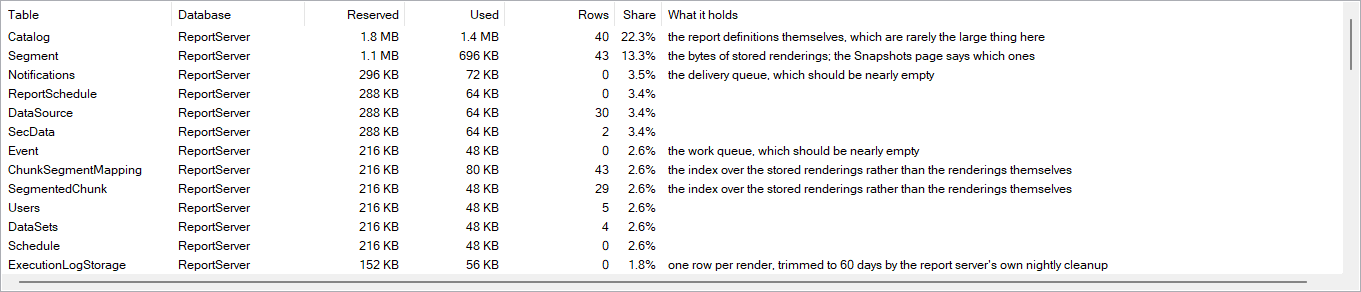
The grid behind the chart lists every table, including the empty ones, with reserved bytes, used bytes, row count, and its share of the total across both databases. A short column called What it holds fills in plain words for the tables that matter, which is most of the work of diagnosing a bloated catalog done before you have run a single query of your own.
None of this requires a maintenance window or a change ticket. It is a read-only look at metadata SQL Server keeps anyway, and it turns a guessing game into an ordered list of tables worth a second look this week.
When One Report Points to Another
The same instinct that leads people to blame the report catalog shows up elsewhere on the same instance: trusting one total number instead of the breakdown underneath it. Is This Index Still Used? Read the Trend, Not the Total makes the same case for indexes that look safe to drop until you look at when they were actually touched, not just whether a counter is nonzero.
The full reference for this report, including every table the grid can show and where its right-click menu sends you next, is at SSRS What Fills This Database.
What to check on your own server
- Check the row counts in Event and Notifications; more than 1,000 rows in either usually means the report server isn't working through its own queue
- Check whether your report server's companion temp database matches the catalog's name with TempDB on the end, and that the login can read it
- Compare Reserved and Used bytes on your largest tables to see how much space old deletes already freed but never gave back to the file
- Note how many days ExecutionLogStorage is configured to retain, since that setting controls how fast the log refills
- Check SubscriptionHistory's row count against your actual subscription list before assuming it's a delivery backlog
Try Database Health Monitor Today
It replaces guessing about a growing report server database with a ranked list of exactly which tables, in which database, are taking up the space. Database Health Monitor shows it on every instance you connect, in the time it takes to open the report.
Download Database Health Monitor and run the SSRS What Fills This Database report against your own server. There is nothing to configure first, and you will know inside a few minutes whether it tells you something you did not already know.