
Across the SQL Server environments we work in, one pattern repeats so reliably that we have stopped being surprised by it. A question arrives at the DBA team from outside the team. Finance wants to know what each database costs. Procurement wants to know whether the Enterprise licenses renewing next quarter are really needed. An auditor wants a list of every table that holds card numbers or Social Security numbers. An infrastructure manager wants to know whether four aging servers could become one. None of these are performance questions, and none of them have a single place in SQL Server where the answer lives.
So the team writes a query against one DMV, then another against a catalog view in every database, pastes the results into a spreadsheet, and discovers two servers were missed. Days pass. The answer that goes back is usually a snapshot of right now, not the month or quarter the question was about.
That delay has a price. Licensing decisions get made on assumptions because the facts took too long to gather. Audits drag on. Capacity purchases are sized on gut feel with a generous margin that someone pays for. And risks that could have been seen weeks in advance surface instead as an outage.
Database Health Monitor version 4.1625 is aimed squarely at those questions. The release adds 29 new reports, 30 new features and 934 bug fixes. Rather than walk through them as a list, this post is organized the way the questions reach a DBA team: by the business question, and by which new reports answer it.
What does each database cost us?
On a shared server, cost allocation is a recurring source of friction. Without data, the split tends to be either even (which the light users resent) or by database size (which ignores the team whose small database burns most of the CPU). Existing views such as CPU by Database answer part of it, but only since the last restart, not over a billing period.
The new Chargeback report answers the question for a month, a quarter or a custom range. It works out each database’s share of CPU, I/O, storage and buffer pool memory, combines those into a weighted share (40 percent CPU, 20 percent I/O, 30 percent storage and 10 percent memory unless you change the weights), and turns that share into a cost from figures you enter: either one monthly server cost, or rates per core, per GB of storage, per GB of buffer pool and per TB of I/O. A treemap shows where the money goes, by database or by cost center.
Several details make it usable in a real finance conversation. Each database can be tagged with an owner and cost center, stored in the history database so everyone sees the same assignments. System databases are treated as shared overhead that can be spread across the others in proportion to their cost, so the charges still add up to the total. An Estate view covers every connected instance, and the Excel export writes a summary plus one sheet per instance. The usage comes from a new hourly collection kept for at least 400 days by default, long enough to compare this quarter with the same quarter last year. A chargeback model only earns trust when it is repeatable month after month, and a database created or dropped partway through a period is prorated and marked as partial rather than quietly distorting everyone else’s share.
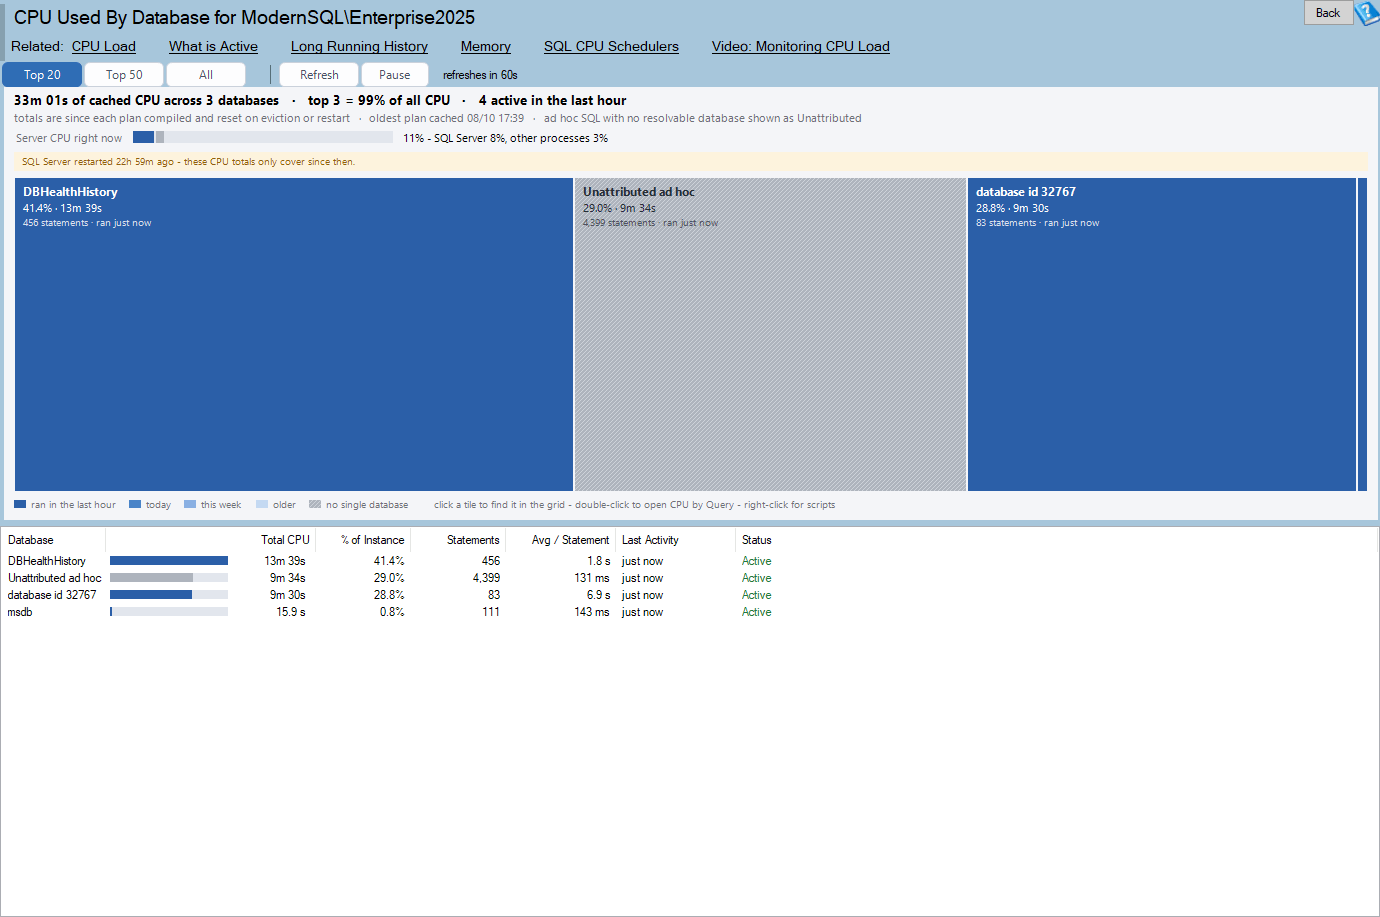
The companion question is not which database, but which application. Workload by Application samples every session every ten seconds and adds up CPU, reads and writes by application, client host, login or database. SQL Server Agent job steps appear under the job name, so a nightly job that quietly dominates the server is visible by name, and a Last 7 days tab shows the same breakdown over the past week. When a business unit disputes its share of the bill, this is the page that settles it. Once a team can see its own consumption, conversations about tuning a heavy process become much easier to start.
Are we paying for Enterprise features we do not use?
Enterprise edition costs several times what Standard does per core. It is common for an instance to have been installed as Enterprise years ago for reasons nobody remembers, and for nobody to be certain whether anything still depends on it. Answering that by hand means checking a DMV inside every database, reviewing availability group settings, reading Agent job steps, and comparing it all against what Standard has allowed since which version. Before a license true-up, that research is worth real money, and it is usually rushed.
The License and Edition Footprint report does the whole pass at once. It shows the facts a license is counted from (edition, version, licensable cores, sockets, hyperthreading, physical or virtual host, and memory) and gives a plain verdict on moving to Standard: possible, possible after removing a stated number of items, or not possible without losing capacity or redesigning. The grid lists every Enterprise feature in use and every Standard capacity limit the instance would hit, with whether each blocks the move and what to do about it.
The report prices the result per two core pack, using figures you can replace with your own, and shows the Enterprise cost, the Standard cost, the difference and what the instance costs today. The Estate view does the same across every connected instance, filterable by server type so production is assessed apart from test and DR. It is a planning estimate, not a quote, and says so, but it turns a vague suspicion into a specific list of servers worth a closer look. It is also conservative: an Enterprise feature it does not recognize is never declared safe, and a database it cannot read is listed rather than silently skipped.
Alongside it, Host and Hardware gathers the facts written down at the start of every health check: processor, sockets, cores, NUMA nodes, memory settings, lock pages in memory, operating system, virtual or physical host, power plan, instant file initialization and service accounts. Each row carries a status and a one line reason, and the page can be saved as HTML for a write up. For licensing it confirms the core count; for everything else it removes the hour of clicking through different tools that starts every review.
Where is our personal and payment data?
Privacy regulations, payment card standards and cyber insurance questionnaires all eventually ask where sensitive data lives. For many database teams, the honest answer is that nobody has looked recently. Schemas grow, and a table with an innocent name turns out to hold dates of birth. The cost of not knowing shows up as audit findings, as scope creep in a compliance assessment, and in the worst case as exposure of data nobody realized was there.
The new Sensitive Data page finds columns likely to hold personal or payment data. The first pass is by name, covering email, phone, address, personal names, date of birth, US Social Security numbers, payment cards, IBAN and bank accounts, national IDs, credentials, health, financial data and IP addresses. Describing words such as a card type or a password change date are not flagged, which keeps the false alarms down.
The second pass, off by default and asking before first use, samples a limited number of rows per table, skips very large tables and can be cancelled. Card numbers are checked against issuer prefixes and the Luhn check digit, IBANs against their mod 97 check, and Social Security numbers exclude ranges that were never issued. Most important for anyone answering to a compliance officer: sampled values are never stored, shown, logged or exported. The tool learns that a column looks like card data without keeping a card number, which means the scan itself does not create a new copy of the data it is looking for.
Finding the data is half the job; recording it is the other half. The page can apply SQL Server sensitivity classifications from a preview script you run, copy or save, using the native classification statement on SQL Server 2019 and later and extended properties on 2012 through 2017. Dismissed columns stay dismissed on later scans, so the review list shrinks instead of starting over.
Sensitive Data by Database lifts this to the instance: one row per database with classified and suggested column counts, card and SSN column counts, and whether the database uses TDE, plus a Scan All Databases button. A grid of databases holding card columns next to their encryption state is often the first document an auditor asks for.
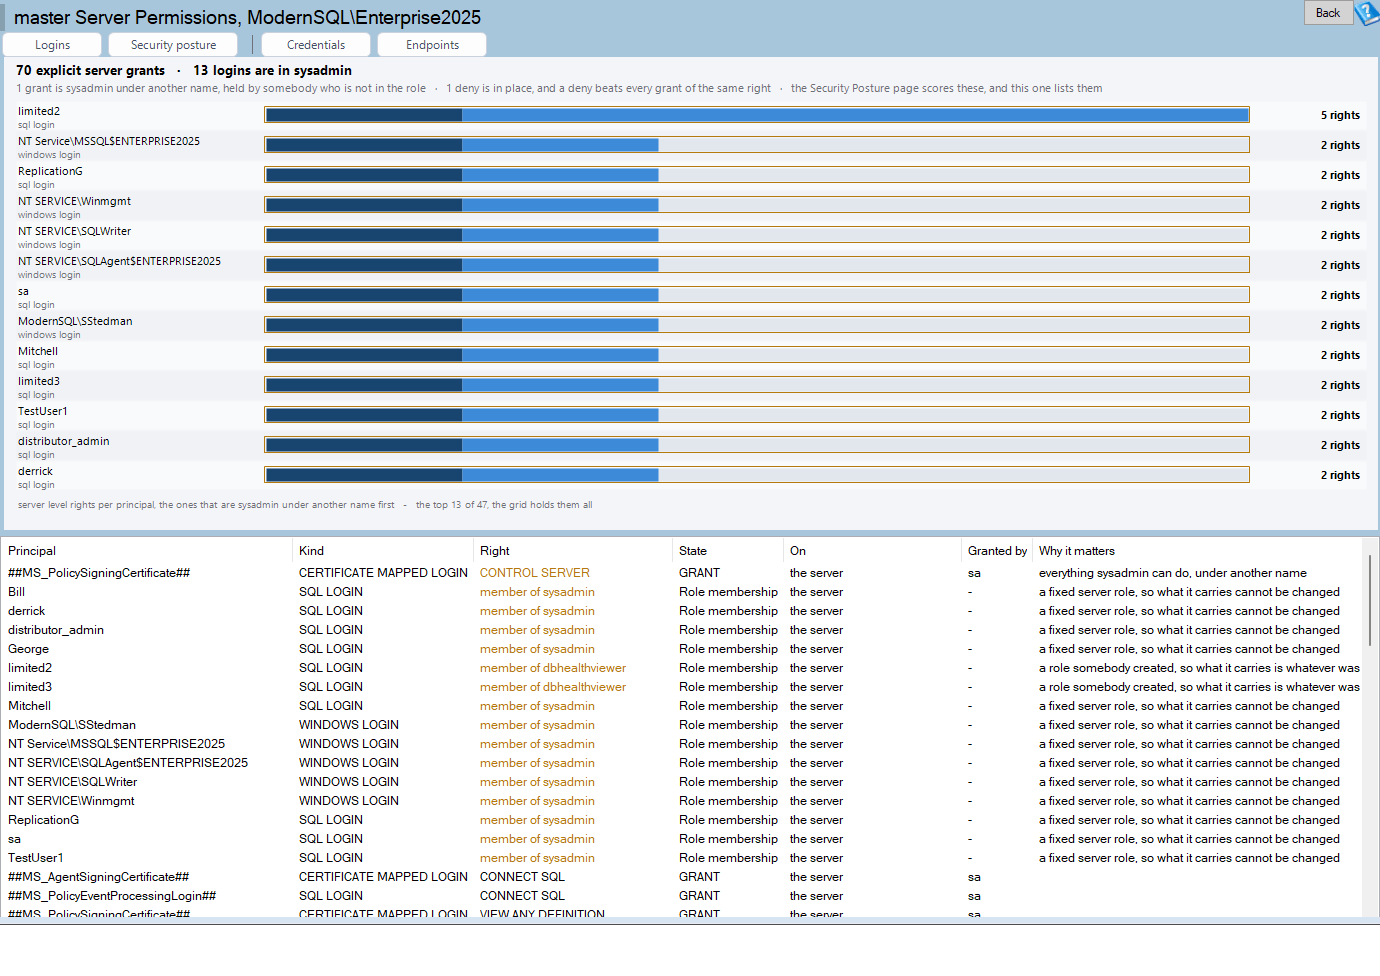
Knowing where the data is leads to the next question: who can read it? The Permissions Matrix maps every login to every database on one page, with nested roles expanded and each cell colored from reading up to owner level access. A Findings view lists the risky access worst first, including grants to public, guest enabled in a user database, db_owner members who are not sysadmin, CONTROL or IMPERSONATE grants and TRUSTWORTHY databases. The workbook export has a sheet per database, the format audit evidence tends to be requested in.
For Azure SQL Database, Azure SQL Health Monitor gains a Security Posture report covering firewall rules, Microsoft Entra administrators, auditing, TDE, Microsoft Defender and permissions on one page, with the fix beside each finding. It changes nothing on its own; the decision stays with you.
Can we consolidate?
Consolidation is one of the most reliable ways to reduce SQL Server spend, because licenses are counted per core and every server carries its own overhead. It is also easy to get wrong. Size the target too small and the combined workload fights for resources; size it too large and the savings disappear. The usual shortcut, adding up each server’s peak, overstates the need because peaks rarely happen together.
The Consolidation Planner, on the Tools menu, works from history instead. You pick the instances and a period of up to 90 days, describe the target (cores, relative core speed, memory, storage, IOPS and throughput), and the planner lines up each instance’s load in 15 minute buckets and adds them bucket by bucket. Two instances that each peak at four cores at different times combine to less than eight, and the planner shows both that realistic peak and the worst case.
The result is a stacked chart with the target as a line, a fit table giving Pass, Tight or Fail for each resource, and a license estimate in two core packs. It warns about instances with less than a week of history, and the plan exports to HTML or Excel for the people who approve the hardware budget.
Consolidating also raises the stakes for availability, since more workloads share one failure domain. The Availability SLA report states how available an instance was over a month: uptime percent against a target you choose, outages, total and longest downtime, mean time between failures, and a day by day heat strip. The monitoring service checks each instance every thirty seconds and records restarts, unreachable windows and gaps in its own monitoring. Outages can be marked as planned maintenance with a note, and the percent is never rounded up, so a month that fell short reads as short. An Estate view lists every instance worst first, exactly the table a monthly service review needs.
Table Growth History covers the storage side. From a new daily sample of every table’s rows and size, it shows which tables are growing and how fast over 7, 30 and 90 days, and projects each table’s size 6 and 12 months out: the evidence behind deciding what to archive, partition or purge before buying more storage.
Will something run out?
Some of the most expensive incidents are entirely predictable: a finite resource consumed slowly until it is gone, with nobody watching the counter.
The clearest example is key exhaustion. When an int identity column reaches its ceiling, every insert into that table fails, and the fix usually means changing a data type on a large, busy table under pressure. In this release the Identity Column Usage page becomes Key Exhaustion and covers sequences too, including CYCLE sequences that would wrap into duplicate keys, with a projected run-out date from daily history. The new Key Exhaustion by Database report ranks the 50 keys closest to running out across every database on the instance, replacing a visit to each one.
A quieter version of the same risk is version store growth. Snapshot isolation keeps row versions in tempdb, and on SQL Server 2019 and later, Accelerated Database Recovery keeps a persistent version store inside the database. Either can grow without limit if something blocks cleanup. Version Store and ADR shows how large each store is and names what is holding it: an old open transaction, a snapshot reader, a lagging availability group secondary, or aborted transactions. The result is a full tempdb, or a database that keeps expanding for no visible reason. Naming the session is the difference between a quick fix and a long night.
Memory Pressure shows when SQL Server ran short of memory and whether the pressure came from its own limits or from Windows, plus memory and page life expectancy per NUMA node, since one starved node can hide behind a healthy average. A Last 7 days tab draws on a new history collection. Before buying more memory, this is the evidence.
Will we hear about it first?
Learning about a database problem from a user or a customer has a cost beyond the outage: it erodes confidence in the team responsible. Twelve new built-in alerts cover the events that most often catch teams off guard:
- SQL Agent job failures, jobs running long, and SQL Agent not running.
- An availability group replica that is not healthy, a changed synchronization state, and a high send or redo queue.
- Deadlocks, 823, 824 and 825 I/O errors, and high severity errors.
- A SQL Server restart, log percent full, and TempDB space.
Every environment also has conditions only its own team knows to check. Custom T-SQL alerts let you write that check in T-SQL and have it alert like the built-in ones, and a copy of a built-in alert now keeps its own thresholds and exclusions.
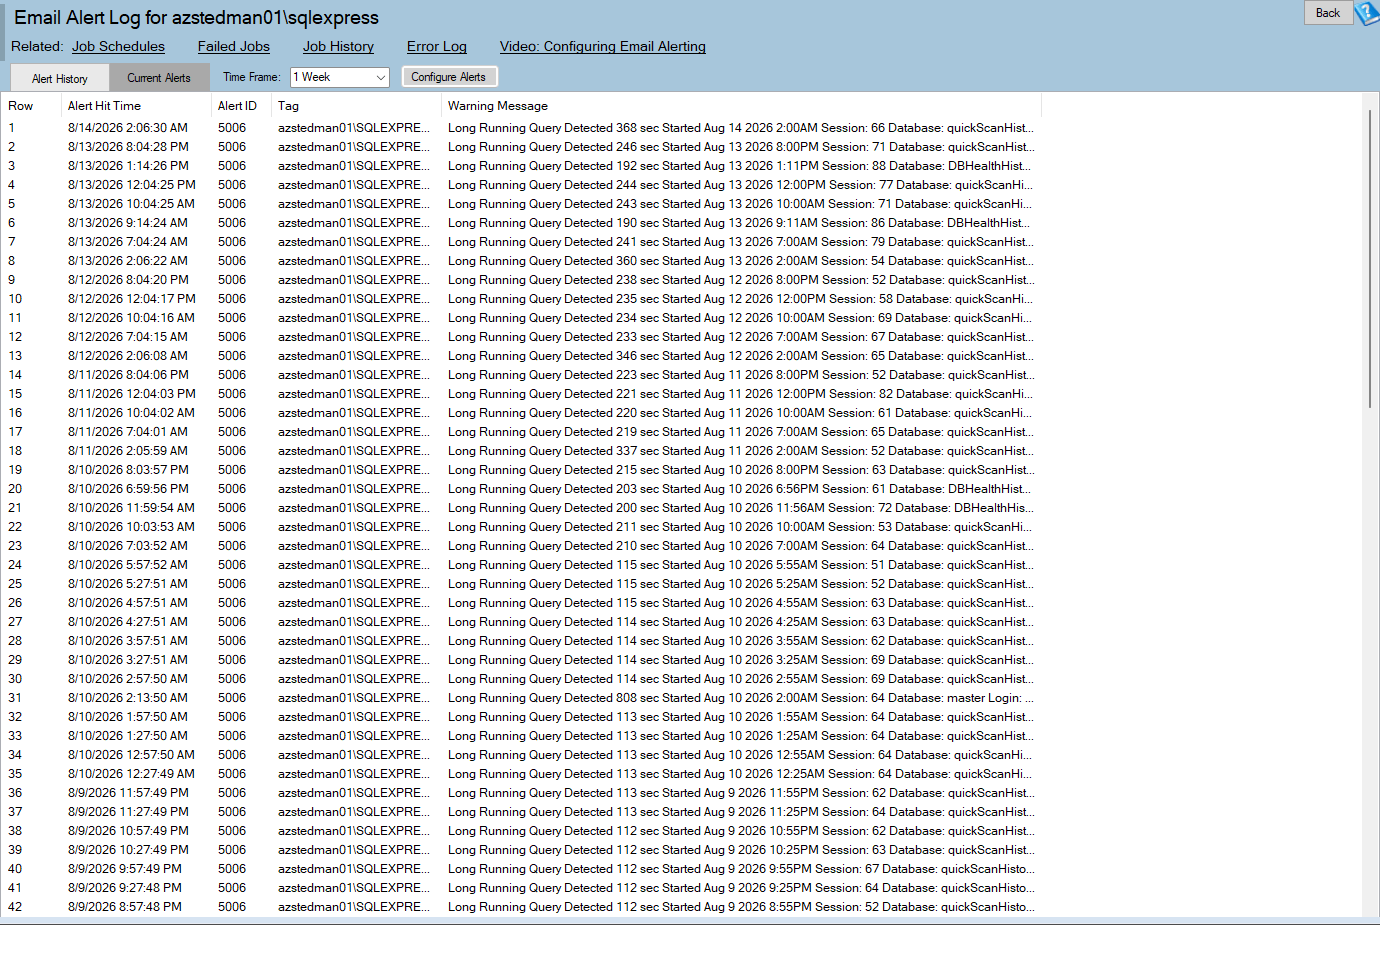
The tray application and monitoring service follow one principle: nothing should go quiet without saying so. Notifications held back by the repeat interval are counted and reported, and a failed poll is shown rather than ignored. Notifications can be snoozed for 15 minutes, 1 hour, 4 hours, until 8:00 AM or until turned back on, and the snooze survives a reboot during patching. Tray icon states now differ in shape as well as color, so health is readable without relying on color, and clicking a balloon opens the history filtered to what it was about. The service writes a lifecycle log and reports a failed start to the Application event log, naming the failed step.
The rest of the 29 reports
Fifteen more reports support the daily work of keeping databases healthy. At the database level: CDC and Change Tracking, Data Compression, Full-Text Search, In-Memory OLTP, Module Execution Statistics (so an expensive trigger can finally be found), Plan Guides and Hints and Temporal Tables. At the instance level: Connections Over Time, Failover Cluster, In-Memory OLTP by Database, Latches and Spinlocks, Module Execution Statistics by Database, Session Waits, Version Store and ADR by Database and Windows Event Log.
Features and fixes, briefly
Among the 30 new features: a redesigned performance dashboard, Save as Excel on grids, plain English explanations of common SQL Server errors, a friendlier crash dialog, toast notifications in place of blocking message boxes, and a Settings dialog that checks values as they are typed. Removing a server from the list asks first and offers Undo, Backup Status gains a Last Diff column, and Quick Scan adds three checks around server naming and linked servers that point back at their own instance. Quick Scan and the 24/7 monitoring both run faster. Schema Drift and Space Recovery now ask before making changes. New history collections feed the trend views above, and the history database repairs itself if tables were dropped.
The 934 bug fixes include 48 crashes and 42 fixes in Azure SQL Health Monitor. Most of the rest address wrong or misleading results, reports that went blank on a timeout, leaked connections, and layouts that did not fit smaller windows. For a tool whose purpose is reliable answers, that correctness work matters as much as any new page.
From question to answer
None of these questions are new. What changes is how long the answer takes and how much trust it carries. A figure drawn from collected history, with its gaps and assumptions stated on the page, is far easier to defend than a spreadsheet assembled the day before a meeting.
The reports produce findings; deciding what to do about them is still a judgment call, and experience helps. If you would like a second opinion on what the reports are telling you, the Stedman Solutions team is glad to help interpret the results.
Database Health Monitor 4.1625 is available now. Download the latest version of Database Health Monitor and put these questions to your own servers.