
Somebody on the storage side asks which query is hammering the disks, and you open the list of top statements by reads. Six of them look equally guilty. Two million pages here, three million there. The number that settles it is logical reads per row, and a total hides it completely.
How do I use logical reads per row to find the SQL Server query that reads too many pages? Logical reads per row is the pages a statement read divided by the rows it returned. A point lookup on a good index reads 3 to 5 pages per row; a lookup reading thousands has a missing or wrong index. Pair it with the share of pages read from storage to find the query behind PAGEIOLATCH waits.
We see this pattern on client servers all the time, across very different shops. The tuning effort goes to the biggest number on the screen. Database Health Monitor includes a Read Amplification report that divides the two figures, and that one division sorts honest work from broken access paths in a few seconds.
Why a total hides the guilty query
Ranking by total logical reads is the habit, and it misleads in one specific way. A reporting query that reads 2 million pages to return 300,000 rows used every page it touched. A lookup that reads 2 million pages to return 12 rows has a missing or wrong index. Ranked by total, they sit on the same line.
The cost is real. The honest report gets tuned for a week and gains nothing. The bad lookup keeps burning CPU, or keeps hauling pages off disk while users wait.
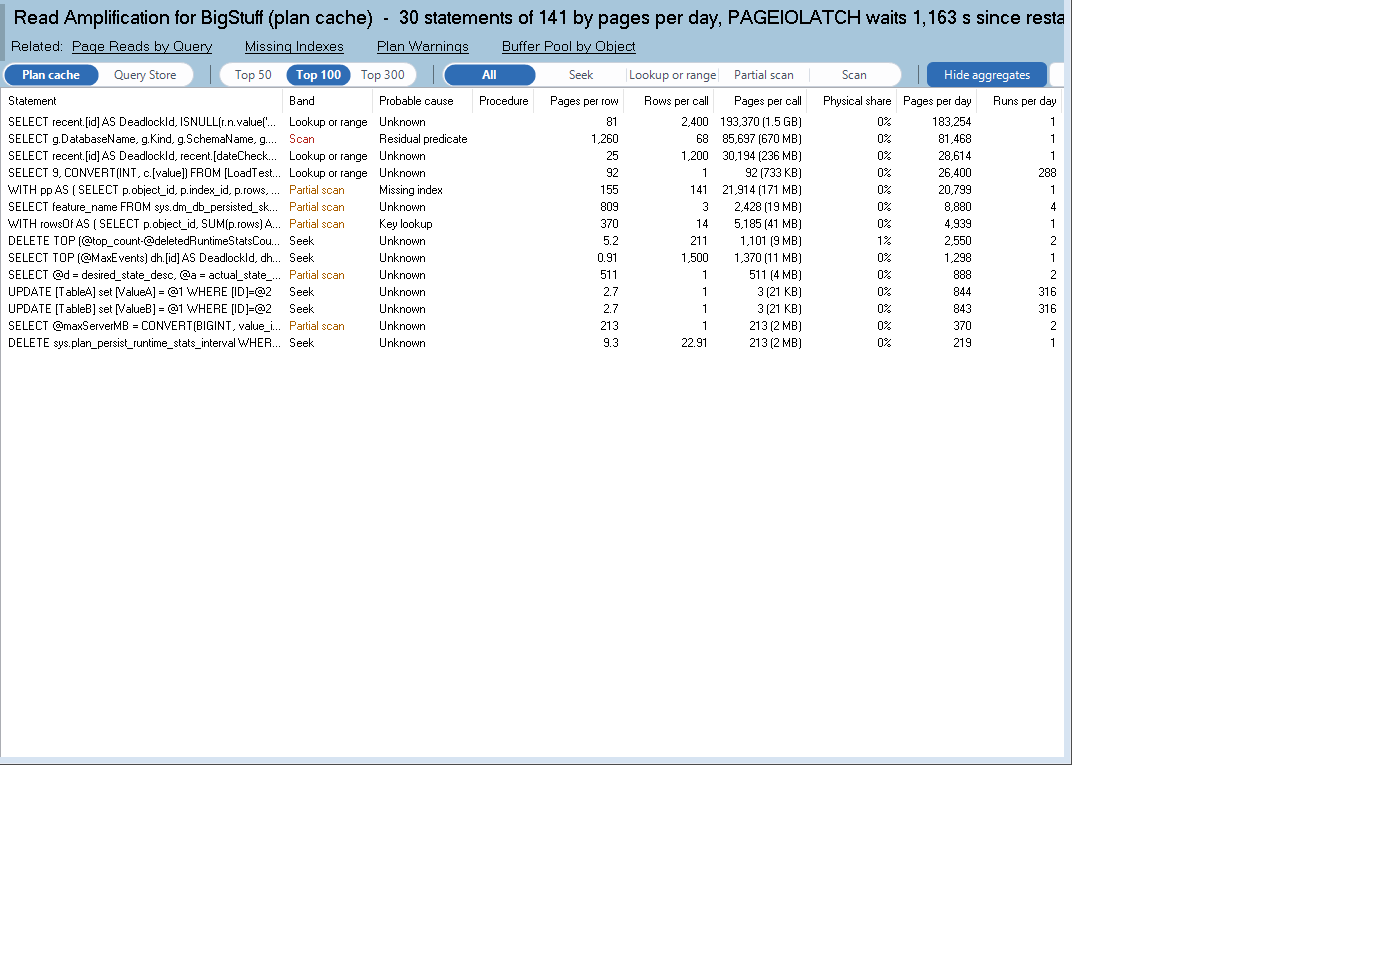
Read Amplification is one of the reports in Database Health Monitor. It runs against your own servers, and it takes about a minute to have this same screen open on one of them.
Logical reads per row is the honest ratio
Pages per row is the oldest index efficiency measure there is. A well indexed point lookup reads 3 to 5 pages for each row it returns. A scan reads thousands. The report sorts every statement into a band so you do not have to judge the number yourself.
| Band | Pages per row | What it usually means |
|---|---|---|
| Seek | Under 10 | Healthy access path |
| Lookup or range | 10 to 100 | Worth a look |
| Partial scan | 100 to 1,000 | Suspicious unless it returns a lot |
| Scan | Over 1,000 | Honest report or missing index |
Then comes the second number, the physical share: the percent of those pages that came from storage. High amplification served from the buffer pool costs CPU. The same amplification with a high physical share is the query driving the disks and the PAGEIOLATCH waits. When the storage pages are red, fix that one first.
One caution. Counters from the plan cache cover the life of the plan, so a first execution that warmed the cache can show a high share forever. With Query Store on, the last 24 hours is the better source.
From a ratio to a fix
Every row gets a probable cause, and the cause is also the next step:
- Key lookup: the plan looks up about once per returned row. Add the fetched columns to the index as
INCLUDEcolumns. - Residual predicate: a seek reads over 10 times more rows than it keeps. Move the column into the index keys.
- Missing index: the plan asks for one, or a scan carries a predicate.
- Aggregate and scan by design: one row per call, or a big report. Nothing to fix, though a
COUNTthat could use a narrower index is still a finding.

Know what the list leaves out. Statements that returned no rows, INSERT ... SELECT and statements under 1,000 pages are skipped, so a three page read never tops the ranking. Folding by query hash also merges literal variants of one statement. The report needs SQL Server 2012 for total_rows and VIEW SERVER STATE for the plan cache.
The write side has its own version of this problem, covered in Write Amplification SQL Server Table: What One Row Costs. For the full column reference, see the Read Amplification documentation.
What to check on your own server
- Divide total_logical_reads by total_rows in sys.dm_exec_query_stats for your busiest statements, on SQL Server 2012 or newer
- Pick out statements above 1,000 pages per row that return only a handful of rows per call
- Compare the share of those pages read from storage against your instance PAGEIOLATCH wait total since the last restart
- Add the fetched columns as INCLUDE columns for any statement whose plan shows a key lookup per returned row
Try Database Health Monitor Today
Total reads cannot tell a report doing honest work from a lookup with a missing index, and the pages per row ratio can. Database Health Monitor shows it on every instance you connect, in the time it takes to open the report.
Download Database Health Monitor and run the Read Amplification report against your own server. There is nothing to configure first, and you will know inside a few minutes whether it tells you something you did not already know.