
Across a lot of client servers we see the same quiet pattern. The nightly load takes a little longer each month, the transaction log grows faster than anyone budgeted for, and the table everybody blames is not even big. Then someone looks closely and finds a write amplification SQL Server table: a modest table with eleven indexes, an audit trigger and a history table, where every single row insert fans out into dozens of page writes.
How do I find the write amplification SQL Server table that costs the most to write? Rank your tables by what one written row costs, not by row count. A write amplification SQL Server table report adds up every index, LOB column, trigger, history table and indexed view touched per insert, then compares that estimate with measured logical writes per row from the plan cache.
Database Health Monitor has a report built for exactly this, and it starts by ignoring the number most people reach for.
Why row count misleads
The usual first move is to sort tables by rows, or by size, and go after the biggest. That finds storage cost. It does not find write cost. A table with two million rows and one clustered index is cheap to feed. A table with fifty thousand rows and twelve nonclustered indexes is not, because each insert has to touch every one of them.
And the indexes are only the start. Each LOB column costs extra writes. A computed column stored in an index adds one. A trigger runs its own statements on every fire. Temporal history writes a second copy of the row. An indexed view that references the table has to be refreshed. None of that shows up in a row count, and a business pays for all of it in log volume, backup size and slower commits.
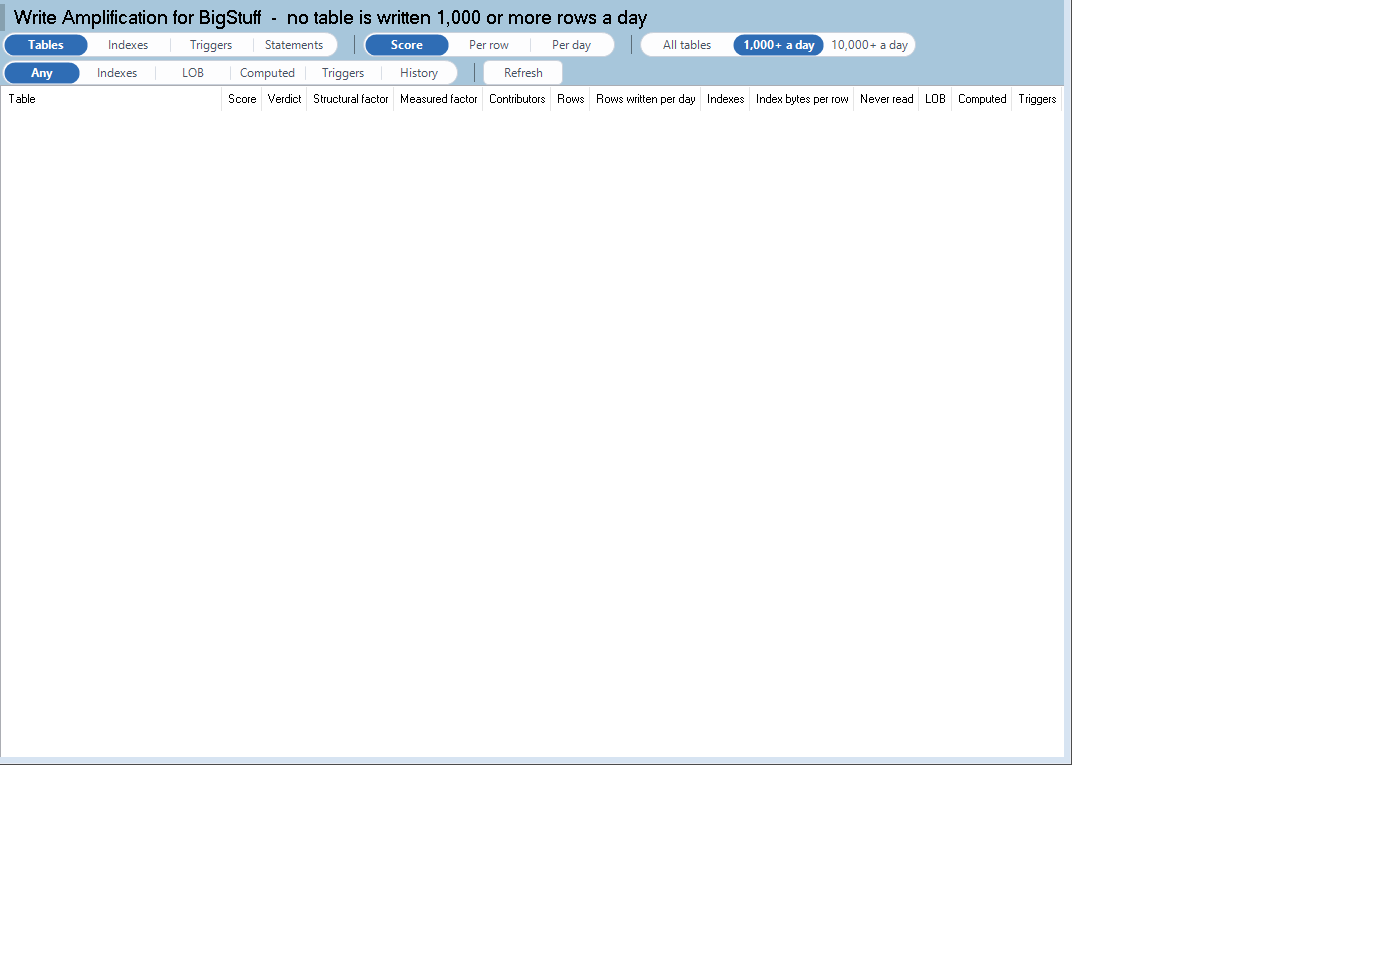
Write Amplification is one of the reports in Database Health Monitor. It runs against your own servers, and it takes about a minute to have this same screen open on one of them.
Two numbers, one honest answer
The report builds two figures for every table. The structural factor is arithmetic from the design. One write for the base index, one per nonclustered index, and a second write when a key is wider than 200 bytes or the index carries a LOB column. Two for each LOB column. One for each stored computed column. The average writes of each trigger fire, one for temporal history, one per indexed view.
The measured factor is evidence. It takes the logical writes of the cached INSERT, UPDATE, DELETE and MERGE statements for the table and divides by the rows the base index saw written. That gives a number you can check, such as one insert into Orders costing 38 page writes.
Why both? Because SQL Server counts a logical write only when a statement dirties a page that was clean. A table whose pages stay cached and dirty between checkpoints can measure far below its structure. So the score uses the larger of the two, and a note appears when the measured figure is under a quarter of the structural one. If the plan cache is unavailable, the measured column says not measured and the structure still ranks the tables.
Finding the write amplification SQL Server table
Under a database, open Real Time, then Write Amplification. The default view is the Tables grid, ranked by Score: rows written per day times the factor. The toolbar can rank by the factor alone, or by rows written per day, and it hides tables written fewer than 1,000 or 10,000 times a day so static tables stay out of the way.
The Verdict column does the triage. High means more than 20 writes per row. Watch means more than 10. Beside it sits the largest contributor, so you know whether to look at indexes, LOB columns, computed columns, triggers or history first.
Two columns deserve a second look. Never read counts nonclustered indexes that have been written and never used for a read. An index written more than 1,000 times a day and never read gets flagged as an unused heavy index, which is the cheapest win on the page. Page splits per day matters too: when splits run above 10 percent of the table's writes, the fill factor or the clustering key is the suspect.
Double click a table to see its indexes. The Triggers view shows fires, logical writes and writes per fire. The Statements view lists the cached DML that writes to the table, with logical writes per execution, so you can see which statement is paying the bill.
What to do with the answer
Start with indexes that are written and never read. Dropping one removes cost from every future write, and the related Unused Indexes report will tell you whether it is safe. Next, look at the trigger. An audit trigger that writes several rows per fire is often the largest contributor, and it is easy to overlook because it lives outside the table definition.
Be honest about the limits. The counters reset on restart or when an index is rebuilt, the cached plans can be younger than the counters, and the report reads the plans of the 300 busiest cached DML statements. The caption prints the start time of the window, so read it before you quote a per-day figure. Memory optimized tables have no leaf counters and drop out of the list.
If you want to see the screen fire before pointing it at production, the sample script builds a heavy table with twelve nonclustered indexes, six of them never read, plus a trigger and system versioning. It lands in Watch with a structural factor of 18, while its lean twin stays under 5. The full column reference is on the Write Amplification help page.
Slow writes can also be a symptom of load rather than design. If a query is fine at quiet hours and crawls when the server is busy, SQL Server Query Slow When Busy? Find Out Which Kind is the companion check to run before you start dropping indexes.
What to check on your own server
- Open the Tables view and rank by Score so the heaviest writers sit at the top
- Read the Verdict column for High (above 20 per row) or Watch (above 10) and note the largest contributor
- Count the indexes in the Never read column on your top table, then review them in Unused Indexes
- Compare the structural and measured factors, and treat the larger one as the honest figure
- Check the caption for the counter start time before you trust a per-day number
Try Database Health Monitor Today
Write Amplification shows what one inserted row really costs each table in indexes, triggers and history, so the expensive writers stop hiding behind a small row count. Database Health Monitor shows it on every instance you connect, in the time it takes to open the report.
Download Database Health Monitor and run the Write Amplification report against your own server. There is nothing to configure first, and you will know inside a few minutes whether it tells you something you did not already know.