
Most teams that run SQL Server do not have a full time database administrator. They have a developer who knows the database, an IT manager who keeps it backed up, and a vendor who gets called when it is slow. For those teams the hard part is not fixing a problem. It is knowing there is one before a customer does, and being able to show someone else what you are seeing without walking them through six screens. Database Health Monitor version 4.1818 is built around that gap.
This release adds custom dashboards you design yourself and can show on a wall, a tile for every instance report so a board is never empty, 9 new reports, a way to pop any report out into its own window, a Patch Currency report that says how far behind each server’s build is, Excel exports that hold real numbers, and 672 fixes. This post explains what that means in business terms: fewer surprises, one picture everyone agrees on, and better conversations with developers, vendors and auditors.
The cost of finding out late
A database problem rarely announces itself. A drive fills up over three weeks. A backup job fails on a Friday and nobody reads the email until Tuesday. A nightly process gets a little slower every week until one morning it is still running when the office opens. Each of those is cheap to fix on the day it starts and expensive to fix on the day it is noticed, and the difference between those two days is usually that nobody was looking at the right number.
Monitoring tools answer that by sending alerts, and Database Health Monitor sends them too. But an alert is a single fact arriving in an inbox, and an inbox is where facts go to be ignored. What a team without a DBA needs is a picture, visible to everyone, that shows whether things are fine and, when they are not, what is wrong. That is what the new Dashboards page is for.
A board your team designs
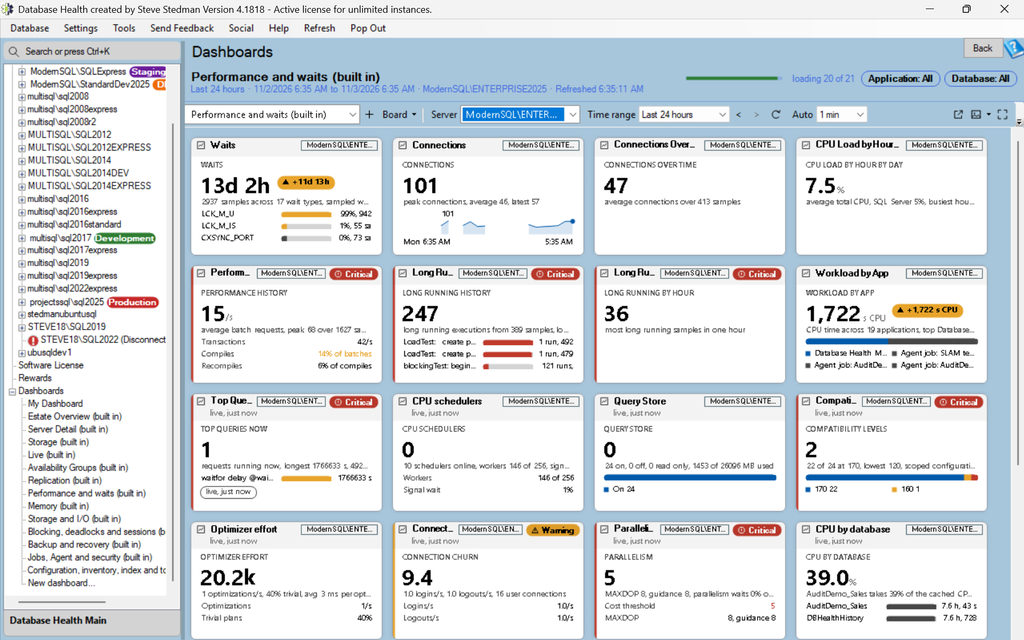
The Dashboards page sits under the Overview pages. A board is a grid of widgets, and each widget shows one thing. A time series chart draws a number over the last hour, day or month. A KPI tile shows one number with a trend against the previous period. A status list shows several checks as rows with a state. A Top N table lists the worst offenders, such as the fullest drives or the slowest queries. A gauge draws free space or a percent as an arc with the amber and red bands on it. A punch card shows deadlocks or alert emails per hour as a grid of days and hours, so a problem that happens every weekday at 2 AM shows up as a stripe. An estate heat map or matrix puts every server on one tile with a colored cell per metric. A text note holds a runbook, a contact list or a checklist with boxes that stay ticked. Clock and image widgets round out a wall display.
You do not have to start from nothing. The program ships read only boards for an Estate Overview, Server Detail and Storage, plus seven boards that follow the report categories: performance and waits, memory, storage and I/O, blocking and sessions, backup and recovery, jobs and security, and configuration and inventory. Each built in board has a server selector, so one board works for any server. Duplicate one and you have a board you can edit.
Editing is drag and drop. Drag a widget by its header to move it, by a corner to resize it, and a ghost shows where it will snap. There is undo, multi select with align and distribute, section dividers and a widget palette. Nothing is kept until you click Save, so trying something costs nothing.
A tile for every report
The reason a board is never empty is that every instance report in Database Health Monitor now has a tile. Drop a Report summary widget on a board, pick the report, and the tile shows that report’s own headline: sessions by state, blocked sessions and the root blocker, the top wait types, the slowest files, backup exposure, failed jobs, disk space with days to full, memory clerks, the Security Posture score, the Quick Scan score with a Scan now button, and more than 90 others. Each is drawn in the shape that fits its data, as bars, segments, dots, progress bars, score rings or trend lines. One click opens the full report for that server.
Those tiles are careful about the servers they watch. A live tile runs one small query with a five minute cache, a timeout and one query per server at a time, so a wall of thirty tiles is a handful of short queries every five minutes and not a load on the server it is meant to protect. History tiles read from the history database the monitoring service fills and never touch the instance at all.
What goes on the wall
Press F11 and the board fills the screen with no window chrome. Wall settings choose which boards to rotate through, how long each stays, which monitor to use and the background. An attention layout collapses the tiles that are fine into a single All OK strip so the tiles that need attention grow to fill the screen, which is the difference between a screen people glance at and a screen people read. A kiosk command line switch opens a wall at sign in and recovers after sleep or a lost network, so a screen in the office does not need someone to log in and click after every reboot.
Thresholds have sensible defaults per metric, and you can keep a different limit profile per environment, so production turns red before test does. A tile that turns critical pulses. The board can show a toast and play a chime, with quiet hours and a mute per tile. A changed value flashes briefly so your eye goes to what moved. Live numbers such as sessions, blocked sessions, CPU now and page life expectancy poll the server every 10 to 30 seconds, and a value that is older than it should be shows its age in amber rather than pretending to be current.
Everyone sees the same picture
The feature that matters most for a team is sharing. Publish a board to the history database on the server your team uses and everyone who can connect to that history database sees it in the board switcher, with a thumbnail, a description and who changed what. When someone improves the shared board, your copy shows an update available mark and one click brings it forward. Boards also export and import as files, which is how you send one to a vendor or keep one in source control, and a board history with restore and a rolling backup protect against the edit nobody meant to save.
For the people who will never open the program, a board can be printed, saved as a PDF, or exported as a 2x image with a white background. Scheduled snapshots save a picture or a PDF of chosen boards to a folder, or email them, every day, every weekday, every week or every few hours. The boards are drawn off screen, so the program does not even need the Dashboards page open, and a command line switch runs the due snapshots from a Windows scheduled task with the program closed. A Monday morning email with a picture of the estate is now something the tool does, not something a person does.
Patch currency: the question your auditor and your vendor both ask
“What version of SQL Server are you on, and is it current?” is a question that comes from an auditor, from a cyber insurance form, from a software vendor’s support desk and from anyone looking at a security incident. The honest answer usually takes an afternoon of looking up build numbers. The new Patch Currency report on the Performance Dashboard answers it for every saved instance at once. One row per server, worst first, with its build, the branch it is on, the latest cumulative update on that branch, how many updates and how many days behind it is, the security builds it has missed, the dates mainstream and extended support end, and an overall status.
The figures come from one shared build catalog that the update available check, the masthead, Quick Scan and the silent report generator now all read, so the different parts of the program can no longer disagree with each other about what current means. An unknown build is never reported as current. Azure SQL Database and Managed Instance are listed as evergreen, because Microsoft patches them for you.
Reports that say what the plan cache cannot
The nine new reports in 4.1818 are for the second half of the conversation, the part where someone asks why. Most of them exist because SQL Server keeps averages, and an average hides exactly the thing a user is complaining about. Here is what each one does, in the order a small team is likely to need it.
Unstable Queries separates a query that is sometimes slow from one that is always slow. SQL Server has kept the best, worst and most recent timing of every cached statement for years, and this report reads them and says which kind of variation it is: a parameter that touches more rows some of the time, a statement that waited behind something else, a memory grant that varies, or one that just got worse in the last hour. Each row names the next report to open. It works on every supported version of SQL Server and does not need Query Store.
Query Findings puts everything wrong with a statement on one row. Plan warnings, bad patterns in the text, estimate errors, spills, missing index requests, key lookups, oversized memory grants and more, each with a severity, adding up to a score. The ten statements at the top of the list are the ten with the most wrong with them, which is a better place to start than the ten most expensive. Copy for a ticket writes the findings in a form you can paste into a work item.
Workload Sample records a short window, one to ten minutes, of everything the server ran, and shows the real spread of each statement’s calls instead of an average. It also catches the statements the plan cache cannot show at all, the ones that recompile on every call or were thrown out of the cache before anyone looked.
ORM Workload Profile names the data access framework behind each connected program, such as Entity Framework, Hibernate, Dapper, JDBC or Access, from the fingerprints it leaves, and scores what each one is doing to the server: Unicode parameters against non Unicode columns, transactions left open, hundreds of tiny queries where one would do, unparameterized SQL. Each finding comes with the fix written in that framework’s own terms, and a right click copies a summary you can send to the developers or the vendor as is. For a team that did not write the application, this is the report that turns “the database is slow” into a specific request to the people who can change the code.
Foreign Keys finds the keys that make a delete on a parent table scan a huge child table because nobody indexed the child side, and shows the cost in rows read per day rather than as a warning. It writes the CREATE INDEX for you to review and never runs it.
Row Width and Data Types finds columns declared far wider than anything they hold, such as a Unicode column that has never held a non English character or a date and time column that has never held a time, and says how many fewer pages every scan would read if the type fit the data.
Plan Cache Churn finds the moments when SQL Server threw away all of its cached plans and had to rebuild them, names the likely cause from the logs, such as a restart, memory pressure or a configuration change, and lists the queries that came back with a different plan afterward.
Auto Statistics Activity captures the statistics updates SQL Server runs on its own and shows which ones made a user’s query wait, which ones replaced a careful overnight update with a quick sample, and which statistics update every few minutes on a busy table, with the specific setting that would stop each.
Patch Currency, described above, is the ninth.
Small things that save an afternoon
Pop out any report. Every report has a Pop Out button that opens it in its own window, so Active Queries can sit beside Blocking Queries while you work. Each pop-out is its own process, so a report that hangs on a slow server freezes only its own window and never the main one. The window is started with the server name only, never a password.
Excel exports hold real numbers. Save as Excel writes numbers, dates and values with units as real cells with number formats, under a bold, frozen, filtered header with fitted column widths. SUM, sorting and charts work in Excel without reformatting first. Anyone who sends a weekly spreadsheet from a report will notice this one on the first day.
Security Posture exports to Word. The whole run, passes and manual checks included, with the SQL Server and operating system versions at the top, goes into a Word document. That is the record an auditor asks for: not only what failed, but every check that was made.
Plan Viewer opens more than one plan. Drag a .sqlplan file onto the window or pick from a recent list to open another plan without relaunching, and Save Copy As replaces a Save that used to rewrite the file you opened.
The tray application does not block. Starting or stopping the monitoring service from the tray icon no longer freezes the menu, a balloon reports the result, access denied is explained, and Stop Service asks for confirmation and offers Snooze instead, which is what most people meant.
Column filter lists are sorted. The value list in a grid column filter is now in alphabetical order.
672 fixes
672 bugs were fixed across Database Health Monitor, Azure SQL Health Monitor, Schema Drift, Space Recovery, Query Loading Ramp, the monitoring service and the tray application, including 15 crash reports. The largest group came from the review sweeps of the new Dashboards page, which is what a feature that size should expect. After that came charts and grids that drew, filtered or clicked wrongly, reads that could not be cancelled, exports, the SSIS and SSRS pages, the deadlock and session waits pages, the Security Posture checks, and reports that gave wrong results on SQL Server 2008 and 2008 R2 and on computers set to a non US locale. Several of those came from users who sent a screenshot. Thank you.
What this means for a team without a DBA
Put together, the release changes who can see what. Before 4.1818, the person who knew Database Health Monitor opened it, read the overview pages and told everyone else what they saw. After it, a board on a screen in the office says whether things are fine, the same board in a manager’s inbox every Monday says the same thing, and the Patch Currency report answers the version question before anyone has to ask. When something is wrong, the new reports produce a specific sentence that can be handed to a developer or a vendor: this statement varies because of its parameter, this framework is sending Unicode parameters against your columns, this foreign key is scanning 40 million rows on every delete.
That is also how we use it. When Stedman Solutions looks after a SQL Server for a client, the dashboards are what we put in front of the client, and the reports are what we use to turn a complaint into a change request. If you would rather have someone watch the board for you, our managed services do exactly that, with the same tool.
Upgrade
Version 4.1818 installs over your existing version and keeps your settings and history. The history upgrader brings an existing history database forward, including the table that shared boards use. Download it from the Database Health Monitor site, run the installer, and let it restart the service. Then open Dashboards under the Overview pages, choose Estate Overview, set the server, and press F11 to see what a wall looks like. If a report asks for a permission or a feature your version of SQL Server lacks, the page says so in plain words and offers the alternative.
If you have a question about the release, or a board you built that you think others should see, tell us. Most of what is in 4.1818 started as something a customer asked for.