
Every DBA has seen a query like this. It ran fine for months, and then one Monday the nightly batch that touches it takes twenty minutes longer, and nobody changed a line of code. The plan still shows an index seek on the exact column in the WHERE clause, and a seek is supposed to be the good outcome. What almost nobody checks is the number sitting right next to it, the one that shows how many rows a SQL Server residual predicate quietly read and threw away before handing back the ten rows the query actually asked for.
What is a SQL Server residual predicate, and why does it slow down an index seek? A SQL Server residual predicate is a filter condition an index seek applies after reading the row, not while narrowing the range it searches. The plan still shows Index Seek, but the seek reads every row in that range and discards most of them, spending logical reads before the WHERE clause rejects anything.
Database Health Monitor has a report built around exactly that number, called Residual Predicates. It goes through the plans Query Store captured for your busiest queries, flags any seek or scan that discarded most of what it read, and names the column responsible along with where it would need to sit in the index key to be skipped instead.
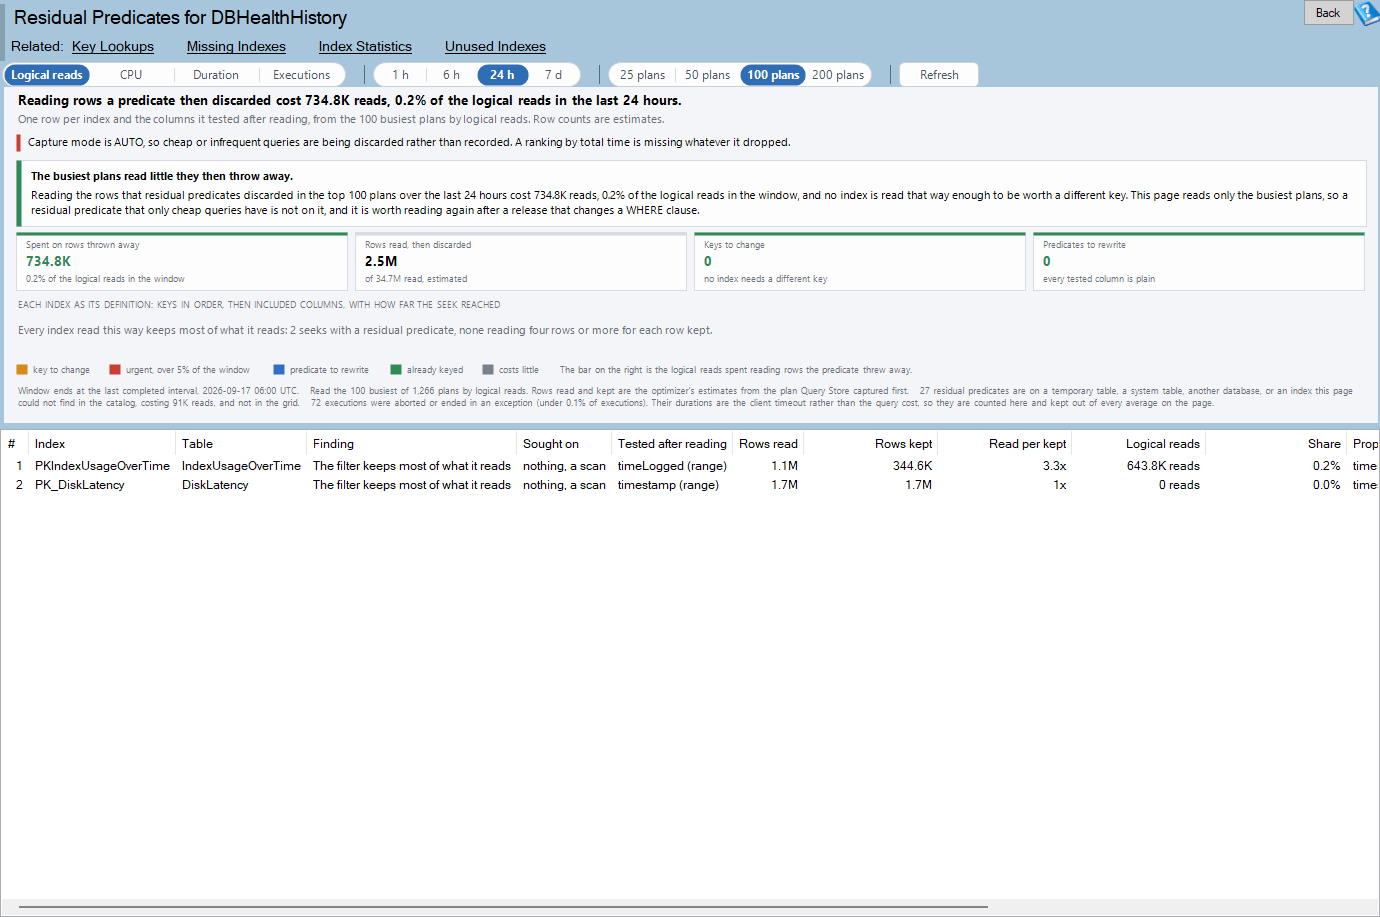
Residual Predicates is one of the reports in Database Health Monitor. It runs against your own servers, and it takes about a minute to have this same screen open on one of them.
In this post
- The Metric Everyone Checks First
- What a SQL Server Residual Predicate Actually Is
- Why Key Order Decides What the Seek Can Skip
- What the Residual Predicates Report Shows
- Reading the Verdict and the Grid
- When the Fix Isn't a Key at All
The Metric Everyone Checks First
When a query like that gets slow, the first instinct is to check 'sys.dm_db_index_usage_stats' and confirm the right index is being used. It is. The seek count climbs every day right along with everything else, and that number answers a different question: whether the optimizer picked the index, not whether it read that index efficiently once it got there.
The second instinct is to watch total duration or logical reads climb and assume the query got heavier: more rows in the table, more users running it. Sometimes that is true. But a seek that reads nine hundred rows to keep ten costs the same nine hundred rows whether the table holds a thousand rows or a hundred million, and the plan itself never raises an alarm about it. Plan Warnings, the built in list of things SQL Server flags on a plan, has nothing to say about a residual predicate. It is not a warning. It is a range that quietly got wider than the query needed.
What a SQL Server Residual Predicate Actually Is
Every index seek scans a range, even a narrow one. An index keyed on 'CustomerID', asked for customer 42, seeks straight to that customer's rows. If the query also filters on 'Status' = 'Open', and 'Status' is not part of the key, the seek still reads every order customer 42 ever placed, and tests 'Status' against each row after it comes off the page rather than before. That after the fact test shows up in a plan's properties as Predicate, separate from Seek Predicate, and it is what gives this kind of waste its name.
Two numbers on the seek operator tell you it happened. 'EstimatedRowsRead' counts what the seek actually pulled off the index. 'EstimateRows' counts what survived the residual test and made it back into the rest of the plan. A healthy seek keeps those two numbers close together. A seek reading nine hundred rows to keep ten has 'EstimatedRowsRead' at nine hundred and 'EstimateRows' at ten, and nothing about the operator's icon or its label tells you that until someone opens the properties and compares them by hand.
Why Key Order Decides What the Seek Can Skip
A seek can only use a key from the front, in order. An index on '(CustomerID, OrderDate, Status)' can seek on 'CustomerID' alone, or on 'CustomerID' and 'OrderDate' together, but never on 'Status' without both columns ahead of it doing the work first. The moment the seek reaches a column tested as a range instead of an exact match, it stops using the key entirely, whatever else is defined after it. That single rule accounts for most of what shows up on this report.
| Where the missed column sits | What actually fixes it |
|---|---|
| Behind a key column the query never filters on | A second index keyed in the order the query filters |
| Behind a column that was sought as a range | A second index with the equality column placed ahead of the range |
| In the included columns, on a seek that already matched every key column exactly | Move it into the key itself; every other query using that index keeps working |
| Inside a function, arithmetic, or a data type conversion | No key order helps; the predicate itself has to be rewritten |
Only the third case is safe to fix by editing the index that already exists, and only when nothing else depends on its current shape: a plain, non unique index, not backing a constraint, where every existing seek already matches all of its key columns for equality. A unique index cannot gain a column without risking duplicate values slipping through, and a clustered key is carried inside every other index on the table, so both of those get a new index built alongside the old one instead.
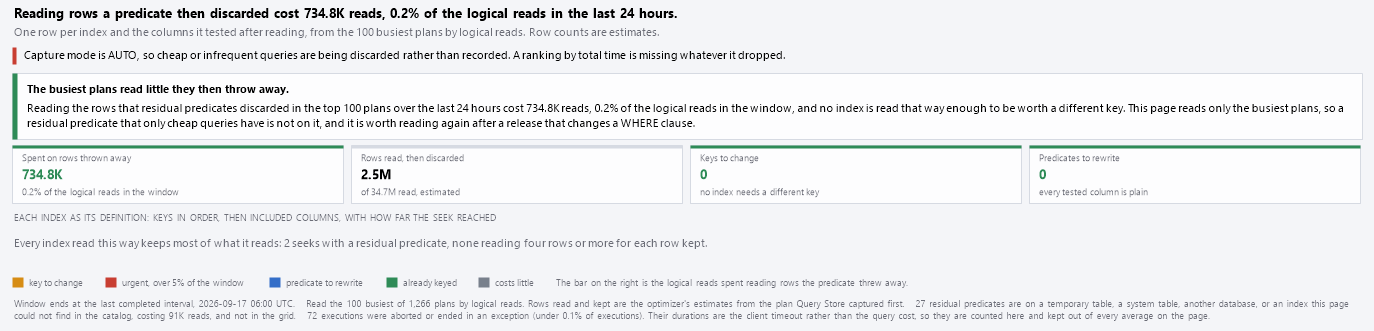
The chart draws each index the way it is actually built: key columns in order, a divider, then whatever sits in the included list. A bar under the key marks how far the seek reached before it gave up on the index and started testing rows one at a time. A dotted line picks up where that bar stops and runs out to whichever column caused the trouble, and a small arc curls back from that column to the spot in the key where it would need to live for the seek to skip past those rows instead of reading them. Color marks urgency, not meaning: orange wants a longer key, blue wants a rewritten predicate, red is spending over five percent of everything in the window, and gray is real but too small to chase this week.
What the Residual Predicates Report Shows
The report lives under a database, in Real Time, then Query Store, then Residual Predicates, and it needs Query Store turned on and SQL Server 2016 Service Pack 1 or newer. 'EstimatedRowsRead' was not written into plans before that service pack, so on an older build the report still opens, it just cannot measure what SQL Server never recorded.
A toolbar picks what busiest means: logical reads by default, or CPU, duration, or executions, a window running from the last hour out to the last week, and how many of the busiest plans get read, from twenty five up to two hundred. A verdict at the top names the single worst offender in plain language, which index, how many rows read for every row kept, and what would fix it.
- The cost of the rows it threw away, weighed against everything the window spent
- Rows read compared to rows actually kept, estimated across the same window
- Indexes worth a longer key or a companion index, filtered to just those with one click
- Predicates worth rewriting because a function or a conversion is hiding the test
Reading the Verdict and the Grid

Below the chart, the grid lists one row per index read a particular way, same columns sought, same columns tested afterward, since two plans hitting an index that way share a single fix. Read per kept is worth sorting by first: under four and the filter is doing real work, well above it and you are looking at a genuine candidate.
Right-clicking a row offers a plain English explanation, the statement that reads the index that way, and a script: either a key extension built with 'DROP_EXISTING', or a new index alongside the old one, copied to the clipboard and never run automatically. Nothing on this page changes a database on its own.
One row type is worth recognizing before you go looking for it: an index that already has the right key, where the plans reading it were simply compiled before that key changed. Query Store keeps the old plan around after the fix ships, and it keeps testing the column the old way until something forces a recompile. What Changed in the Query Plan Before It Got Slower covers other ways a plan keeps running against a shape of the data that no longer exists; a key that was already fixed is one version of the same problem.
When the Fix Isn't a Key at All
Not every residual predicate is a key order problem. A column tested inside a function, 'YEAR(OrderDate)' for instance, or wrapped in arithmetic, cannot be sought by any index no matter how the key is built, because the index stores the column's own values, not the result of running a function against them. Rewrite it as a plain range check on the column itself, instead of inside the function, and the identical test becomes something an index can seek on directly.
A quieter version of the same problem is an implicit conversion, where a comparison against a column of one data type silently converts it to another before testing it. SQL Server does this without complaint, and the plan will not call it out unless someone already knows to check the predicate's data type on both sides. Both cases get marked the same way on the chart, a hatched box that never gets an arc pointing anywhere, because there is no place in the key that would help.
None of this requires guesswork. The numbers are already sitting in Query Store on every plan that has run since the service pack that started recording them, and the report puts 'EstimatedRowsRead' next to 'EstimateRows' for every seek and scan in the busiest hour or week, sorted by what the gap actually cost. What it will not do is change anything on its own; every script it produces sits on the clipboard until someone reads it and decides to run it. The full reference for every column in the grid and every message the page can show lives in the Residual Predicates documentation. The next time a query that used to be fine starts running long, the seek in its plan is worth a second look before anything else.
What to check on your own server
- Turn on Query Store for any database where you suspect queries are reading more than they return
- Open a slow seek's properties and compare 'EstimatedRowsRead' against 'EstimateRows'
- Check whether rows read per row kept is above four for that seek
- Note whether the tested column sits behind a range-sought key or inside a function, since only the first can be fixed by reordering the key
Try Database Health Monitor Today
It finds every index seek that reads far more rows than it returns, names the column responsible, and shows exactly where in the key it needs to move. Database Health Monitor shows it on every instance you connect, in the time it takes to open the report.
Download Database Health Monitor and run the Residual Predicates report against your own server. There is nothing to configure first, and you will know inside a few minutes whether it tells you something you did not already know.
Related reading: What's Really Driving Your ReportServer Database Size. A companion piece walks through why a Reporting Services catalog's storage growth almost never comes from report definitions, and shows how to rank every table across the catalog and its temp database by the space it actually reserves.