
The same pattern turns up at shop after shop. An application throws the occasional deadlock victim error, someone looks at the SQL Server deadlock history, and finds a number. Forty last month. Maybe sixty this month. Everyone agrees it is bad, and nobody can say what to change on Monday.
How do I use SQL Server deadlock history to find what is actually colliding? The most useful SQL Server deadlock history groups every recorded deadlock by the object being fought over and pairs the blocker statement with the victim statement. Thirty-eight deadlocks on one table under the same two statements points at a specific fix, where a bare monthly count only says a problem exists.
That gap between a count and a fix is where weeks disappear. Database Health Monitor records every deadlock on a fifteen minute timer, and its Deadlock History report is built to close that gap. It does not ask how many. It asks what keeps colliding with what.
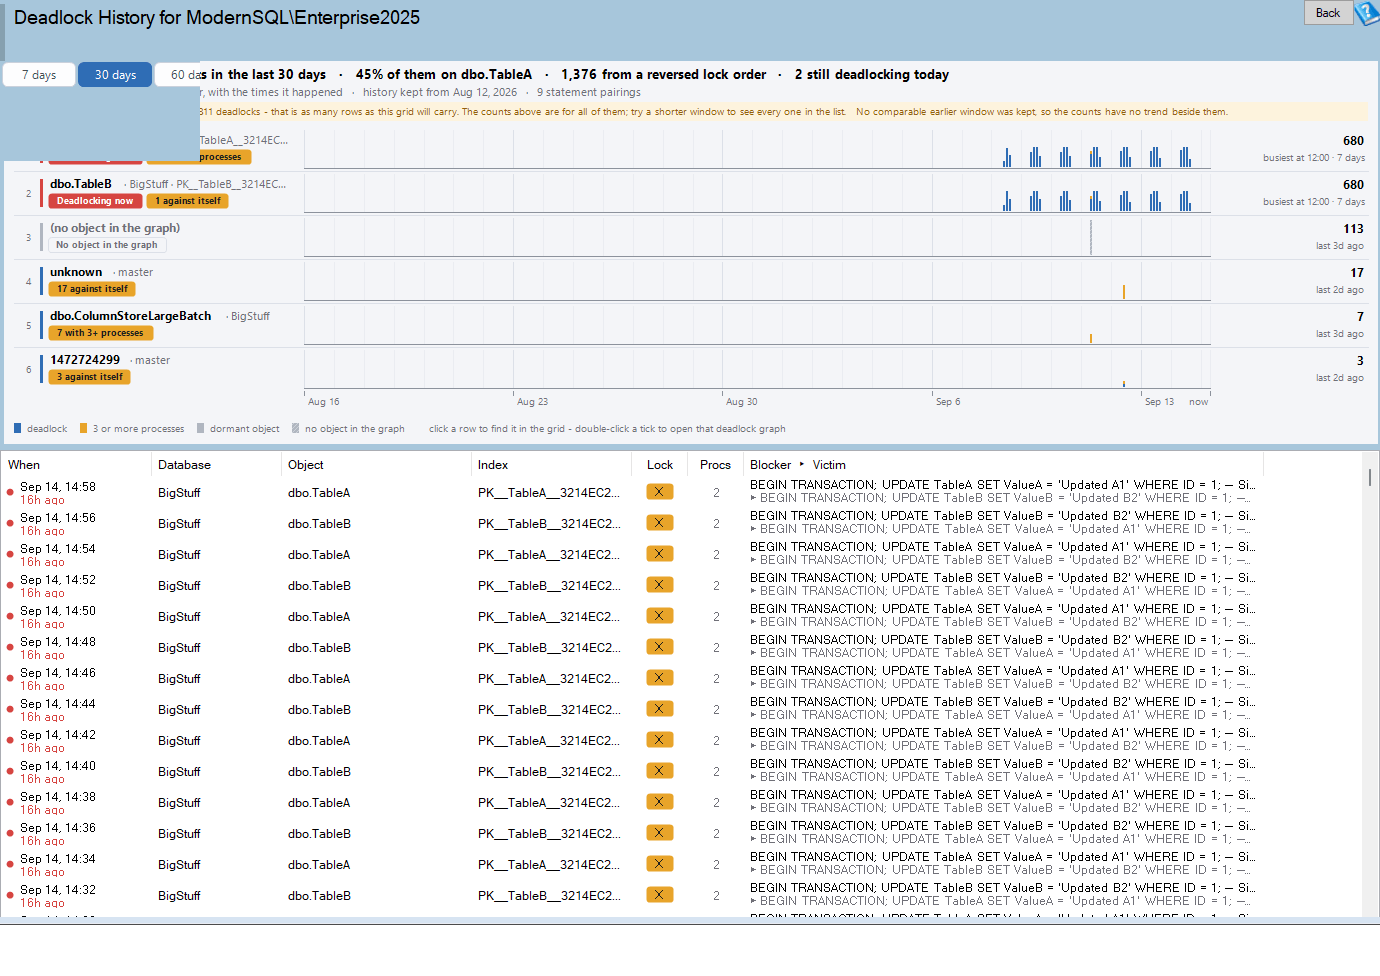
Deadlock History is one of the reports in Database Health Monitor. It runs against your own servers, and it takes about a minute to have this same screen open on one of them.
Why a deadlock count is not a diagnosis
The first thing most people reach for is a total. Deadlocks per day, deadlocks per database, maybe a line on a chart. It feels like measurement. It is really a smoke alarm: it confirms a fire and says nothing about the room.
Counts also lie in quiet ways, and we have seen each of these in the wild:
- Fan-out. A query that joins every non-victim process in the graph returns two rows for a three process deadlock. Apply that join twice and you get four rows, and a four process deadlock gives nine. Fifty rows can be a dozen real deadlocks.
- Silent truncation. A
TOP 50with no notice makes an instance with twelve hundred deadlocks look exactly like one with fifty. - Confident zeros.
ISNULL(spid, '')over an integer column converts the empty string to0, so a missing value is displayed as a real session id.
Each of those makes the number wrong, not merely ugly. And a wrong number invites a wrong fix. Teams add an index, bump a retry count, or blame the last deployment, then watch the count and wonder why it has not moved.
What SQL Server deadlock history should show you
Measure the collision, not the casualty. Two things decide the fix: the object being fought over, and the two statements doing the fighting. Knowing that thirty-eight of forty deadlocks were on dbo.OrderLine under the same pair of statements is a different class of fact than knowing there were forty.
That is the honest number because it survives scrutiny. One row per deadlock, whatever the graph contains, with the object, lock mode and both statements read off that single graph. If the window held more than the page fetched, the notice band says how many were left out. You always know whether you are looking at everything or at a sample.
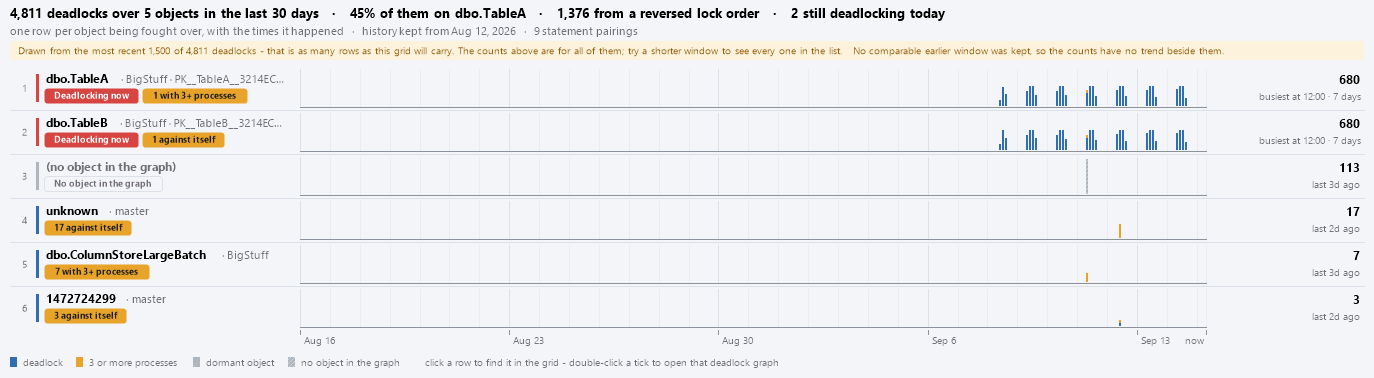
Every object carries a badge, and the badge matters more than the count. Deadlocking now means something deadlocked on it within the last day. Chronic means it deadlocked on at least 60% of the window's days, across at least three affected days, which is the signature of a problem built into how the application works. Dormant means two weeks of silence: history, not a problem. Objects whose graph named nothing are drawn hatched, never blank, so the unexplained ones stay visible.
Chronic and Dormant only apply to windows of a week or more. Shorter than that, a window has no rhythm to judge, so rows are simply active or normal.
Three views, one question each
| View | Question it answers | What you see |
|---|---|---|
| Hotspots | What is being fought over? | Objects ranked by contention, each with a spark strip |
| Stream | When does this happen? | Every deadlock on one axis, with a day histogram and an hour ribbon |
| Pairs | Which two statements collide? | Blocker statements joined to victim statements by weighted ribbons |
Pairs is the view that usually produces the fix. A thick ribbon between two statements is an access order problem with its name on it. Past seven pairings the ribbons get hard to tell apart, so the tail is rolled up rather than drawn as a thicket.
Stream earns its place on the second visit. A spike at the same hour every day is almost always a scheduled job. A smear across the working day is ordinary load. Those two call for completely different conversations.
Where an equivalent earlier window was kept, each object also shows its trend, something like +486% on the previous 30 days. Where it was not kept, the page says so instead of implying a trend it cannot back up.
Reading the grid underneath
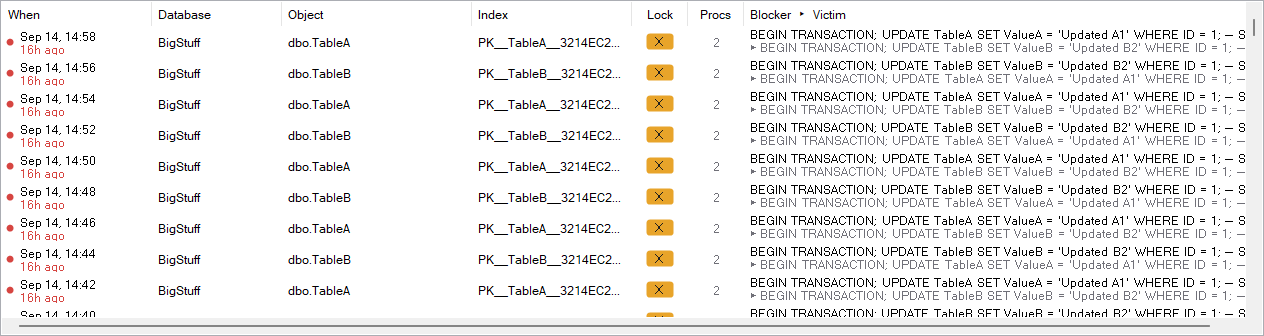
Below the chart sits one row per deadlock: when, object, index, lock mode, process count, and the blocker and victim statements as fingerprints. A deadlock with more than two processes wears an amber mark. Those are rarer and harder to reason about, and the shape of the graph matters more than any count, so read the graph rather than the grid.
Double-click a row and the deadlock advisor opens that exact graph, showing hostname, session, login, isolation level and client application for the victim as well as the blocker. The older grid tried to cram those columns in for one side only. The right-click menu copies the blocker statement, the victim statement, the object name, or an investigation query, which is handy when the conversation moves to a developer.
One more requirement. This is a historic report that reads the DeadlockHistory table in DBHealthHistory, so collection has to be configured for the instance. The upside is that it works when the monitored server is down, which is exactly when people go looking.
What to do with the answer
Start in Hotspots, read the badge, switch to Pairs for the top object, then open one representative graph. After that, the pattern usually names the next step:
- One object, two statements, thick ribbon. The classic. Two code paths touch the same rows in opposite order. Fix the ordering or narrow the transaction. Our post on Reversed Lock Order: The Deadlock That Keeps Coming Back walks through that case.
- Chronic on a small lookup table. Usually an update in place on a hot row: a counter, a sequence table, a status flag.
- Active, with a very recent first appearance. Something changed. Suspect a deployment, a new index, or a plan change.
- Many unattributed deadlocks. The graphs named no object. Often lock escalation or an in-memory structure rather than a table.
- Dormant rows crowding the page. Old problems, already fixed. Narrow the window to see what is current.
Related pages help here. Deadlocks by Database tells you which database and when, Blocking Tree shows contention that has not become a deadlock yet, Tables With Triggers explains writes that hold locks longer than they should, and Missing Indexes often resolves a deadlock by turning a scan into a seek.
The full column and menu reference lives in the Deadlock History documentation. The business case is simpler. A deadlock you can name is a deadlock you can schedule a fix for, and the cost of finding that out the hard way is measured in retries, support tickets and weeks spent arguing about a number that was never going to tell you anything.
What to check on your own server
- Rank your recorded deadlocks by object and note which one sits at the top
- Read the badge on that object before its count, and treat Deadlocking now and Chronic as the ones needing action
- Find the thickest blocker to victim pairing for the top object and write down both statements
- Check whether deadlocks cluster at one hour each day or smear across the day
- Open one representative deadlock graph and compare both sides in full
Try Database Health Monitor Today
Deadlock History ranks the objects your sessions fight over and pairs the blocker statement with the victim statement, so you know which code path to change. Database Health Monitor shows it on every instance you connect, in the time it takes to open the report.
Download Database Health Monitor and run the Deadlock History report against your own server. There is nothing to configure first, and you will know inside a few minutes whether it tells you something you did not already know.