
An insert that should be instant takes far longer than anyone can explain. A developer swears the procedure touches one table, yet the deadlock graph shows locks on three. A bulk load finishes cleanly and a handful of rows are quietly wrong. Across shops of every size, we trace these back to the same place: SQL Server triggers that nobody remembered were there, firing on every write.
How do I find out which SQL Server triggers fire when a table is written? Query sys.triggers joined to both tables and views, then judge each trigger by its events, its timing (AFTER or INSTEAD OF), whether it is enabled, how many lines of code it holds, and which tables it writes to. A count of SQL Server triggers hides the disabled ones and the write chains.
Triggers are the part of a database that runs without being called. That is exactly why they get forgotten. Database Health Monitor has a report built to put them back on the page, and it is worth understanding why the usual approach to listing them fails.
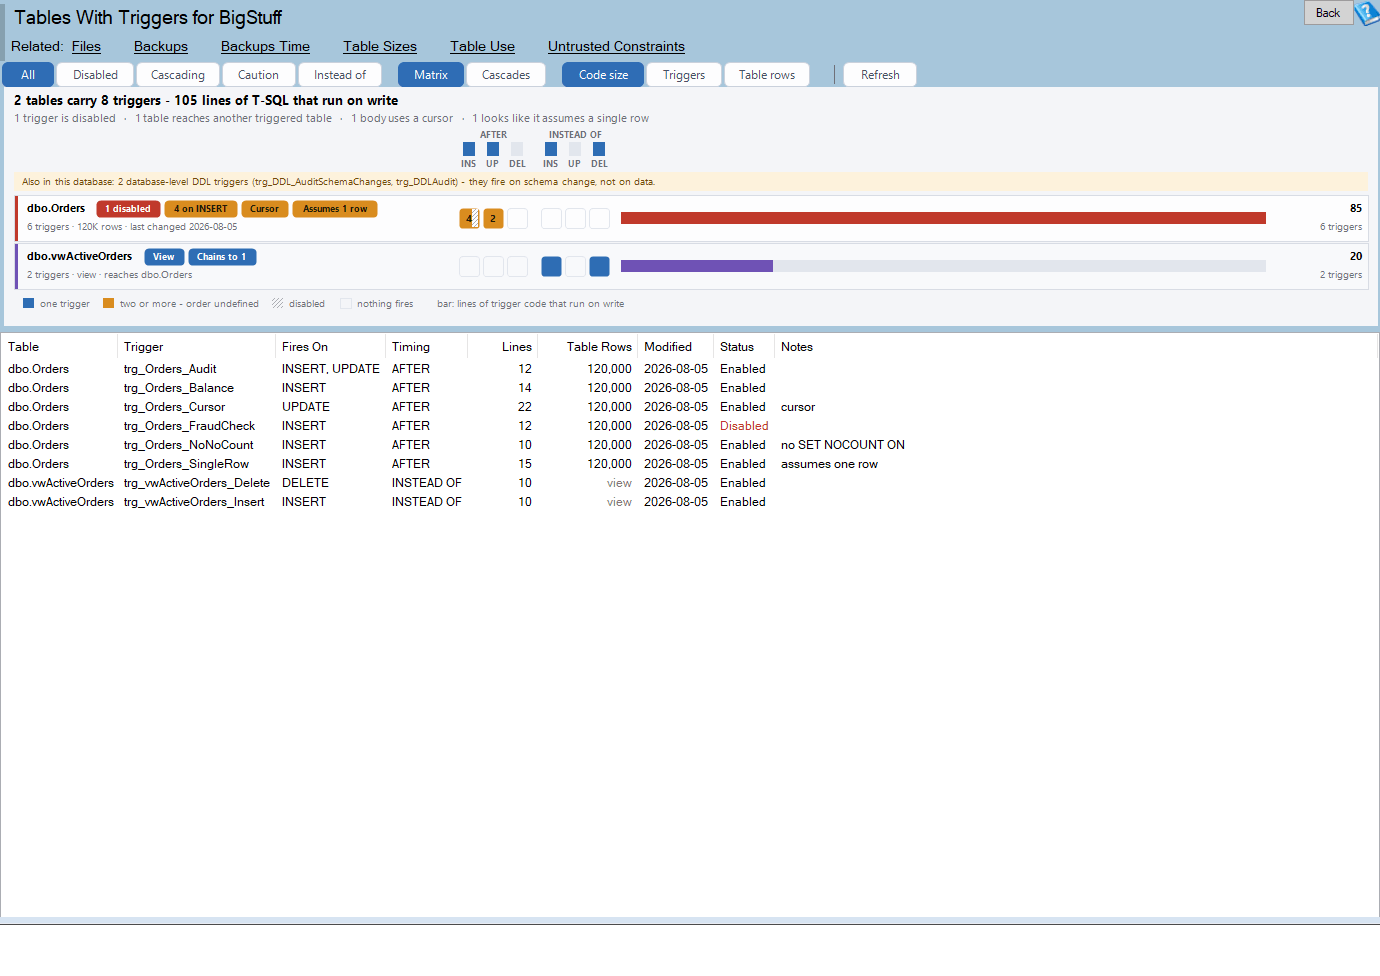
Tables With Triggers is one of the reports in Database Health Monitor. It runs against your own servers, and it takes about a minute to have this same screen open on one of them.
Why a trigger count tells you nothing
The obvious move is to count triggers per table and sort. We see it all the time. It feels like an answer, and it misleads in a specific way: on almost any database the count is one, two or three. Every bar on the chart is one of three lengths. A thousand-line trigger and a three-line trigger score the same.
The query behind that count tends to be wrong as well. sys.triggers holds DML triggers on views, and it holds database-level DDL triggers. A query that left-joins sys.tables returns those with no schema and no table, and a grouping then merges them into one blank row with a number on it. On a database with an INSTEAD OF view trigger and an audit DDL trigger, that anonymous row can sit at the top of the list and explain nothing.
Then there is the filter people add without thinking: WHERE is_disabled = 0. It looks tidy. It also throws away the most interesting row you have. A disabled trigger is business logic somebody turned off, usually in the middle of an incident, often years ago. Nothing else in the usual toolkit goes looking for one.
Measure what the trigger does, not how many exist
The honest question is not how many triggers a table has. It is what fires when something writes to it. That breaks into a few facts that actually carry risk:
- Event and timing.
AFTER INSERTandINSTEAD OF DELETEare different things. The second means the write you think is happening may not be. - State. Enabled or disabled, and whether the body is encrypted and cannot be read.
- Size. Lines of code, because a large body runs inside every single write.
- Context. The row count of the table it sits on. The same trigger is a different risk on ten rows and on ten million.
- Reach. What the trigger writes to in turn, and what those tables fire after that.
That last one is the dangerous one. A write to table A fires a trigger that writes to table B, which fires another. No list shows that chain. It only appears when you draw it.
What the report shows about SQL Server triggers
The Tables With Triggers report starts with a firing matrix. One row per table, one cell per event and timing combination. The bar in each row is lines of trigger code rather than a count, so a heavy trigger finally looks heavy. The chart draws the busiest 14 tables, while the grid carries every trigger. A histogram above the columns shows where triggers cluster, and clicking a column filters the page to it. That is the quickest way to ask what fires on delete anywhere in this database.

Small chips flag what is worth knowing about each table. A red 2 disabled marks switched-off logic. Chains to 3 says the table's triggers write to three other tables. 4 on INSERT means several triggers share one event, so firing order matters and is rarely defined. Amber chips call out Cursor, No NOCOUNT and the one we would hunt first, Assumes 1 row.
That last chip is a trigger written as if inserted always holds one row. It works for years. Then somebody inserts two rows in one statement and it silently corrupts data. Nobody gets an error, which is the whole problem.
A second view draws the cascades as a node-link diagram, table to trigger to table. A long chain is a design you want to know about before you debug it. A cycle you want to know about immediately.

The grid has one row per trigger. Notes sits right after the name and spells out everything the chips say. Beside it are Status, Fires On, Timing, Lines, Table Rows and Modified. A toolbar filters to Disabled, Cascading, Caution or Instead of, and a Rank by control swaps the question: code size finds the biggest bodies, triggers finds the most crowded tables, table rows finds the triggers running over the most data.
Reading it in the right order
Order matters, because the findings are not equally urgent. We work through them like this.
- Filter to Disabled. Either the logic is needed or it is not. Leaving it off is a decision nobody made.
- Look for Assumes 1 row. These are latent corruption bugs waiting on a multi-row write.
- Open the Instead of filter. Confirm each one is intended, and remember that views often carry legitimate ones.
- Switch to Cascades. Chains and cycles are invisible in the grid.
- Rank by Code size, then read Lines next to Table Rows. Heavy code on a large table is where the cost lives.
Cursors deserve a note of their own. A trigger with a cursor runs per row, inside the write, while holding locks. It is nearly always rewritable as set-based logic. That connects directly to blocking and deadlocks, since a trigger stretches the time every write holds its locks. If a table keeps showing up in deadlock graphs, check what fires on it. When the symptom is a plan that suddenly got slower rather than a write, What Changed in the Query Plan Before It Got Slower covers the other half of the investigation.
What to do with the answer
Nothing on this page runs anything. Enabling or disabling somebody's business logic is not a decision a report should make for you, so the right-click menu copies scripts to the clipboard and stops. You can copy the full CREATE TRIGGER body, the ENABLE TRIGGER or DISABLE TRIGGER statement that applies, and a what-fires-on-this-table query for investigation. Where several triggers share one event, it also offers an sp_settriggerorder script, because otherwise their order is not guaranteed.
Double-click a row to read the body. If some triggers on the table are encrypted, the viewer says so instead of quietly showing fewer.
Some findings are small. A trigger without SET NOCOUNT ON sends extra row-count messages to the client on every write, and some client libraries handle them badly. Individually minor, but worth fixing in bulk.
Others are decisions. A long chain that is correct still needs documenting, because the next person debugging it will not expect it. A disabled trigger needs an owner and an answer. Stored procedures are the other place business logic hides, so the same scrutiny belongs there. The full column and menu reference lives in the Tables With Triggers documentation.
The cost of this work is small next to the cost of finding out the hard way. A corrupted multi-row load or a trigger switched off since an old incident is far cheaper to find on a quiet afternoon than during an outage.
What to check on your own server
- Filter the trigger list to disabled triggers and decide, one by one, whether the logic is still needed
- Review every trigger that assumes the inserted table holds a single row before a multi-row write finds it
- Check each INSTEAD OF trigger to confirm the write you expect is the write that actually happens
- Trace the longest cascade chain, document it, and look for any cycle
- Rank triggers by code size and compare lines against table rows to find the expensive ones
Try Database Health Monitor Today
Tables With Triggers shows every trigger on every table and view, including the disabled ones and the write chains, so nothing fires without you knowing. Database Health Monitor shows it on every instance you connect, in the time it takes to open the report.
Download Database Health Monitor and run the Tables With Triggers report against your own server. There is nothing to configure first, and you will know inside a few minutes whether it tells you something you did not already know.