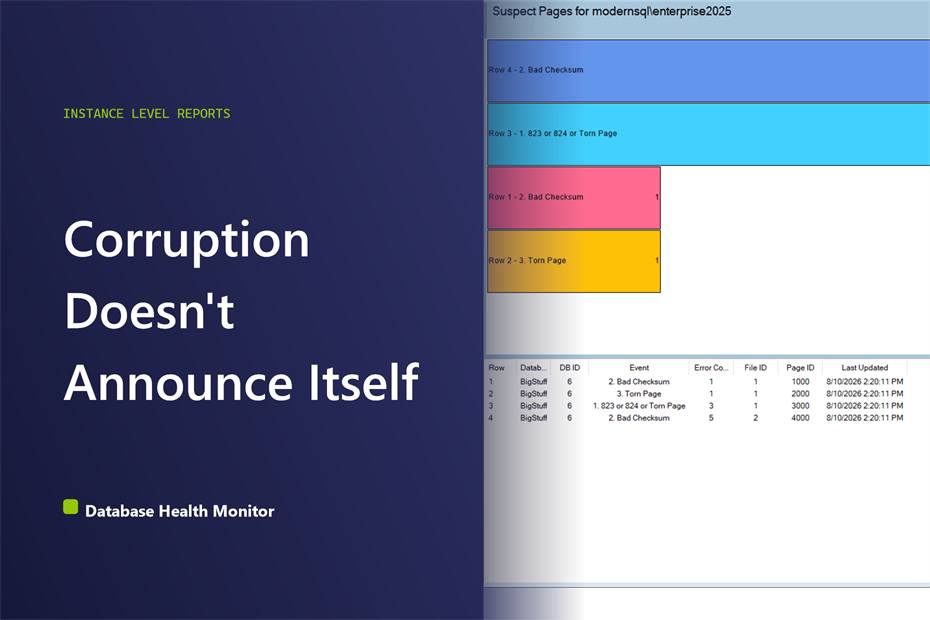
A report that has run the same way for two years throws an odd error at 2 a.m., then runs clean again by morning. The DBA on call retries it, watches it succeed, and closes the ticket before coffee. Nobody checks whether anything got written down about that first failure, because nothing on screen suggests it should have been. Something did: SQL Server suspect pages are exactly this, one row for every page the engine failed to read cleanly, filed away in msdb long after the error has scrolled off the log.
What are SQL Server suspect pages? SQL Server suspect pages are rows in msdb..suspect_pages, one per page the engine could not read correctly: a bad checksum, a torn page, an 823 or 824 error. The table also records outcomes such as a restore or a DBCC CHECKDB repair, so a page that has been fixed can be told apart from one still failing.
The instinct is to treat it as a fluke. A retry that succeeds looks exactly like a network blip or a disk catching its breath, and most teams move on without a second thought. A green light on last night's 'DBCC CHECKDB' job does not help either, because a page that failed mid-query is not necessarily one 'CHECKDB' happened to touch. Both signals feel reassuring. Neither one is looking at the right thing.
What SQL Server Already Wrote Down
SQL Server does not shrug off a bad read. The moment it hits a page with a checksum mismatch, a torn write, or an '823' or '824' error, it adds a row to 'msdb..suspect_pages' and keeps working. Six event codes cover the table: three describe damage, a general read failure, a bad checksum, or a torn page, and three describe an outcome, a restore, a 'DBCC' repair, or a deallocation that threw the page away. The number worth trusting is not whether last night's job passed. It is the error count on that row, because a count above one means something is still failing.
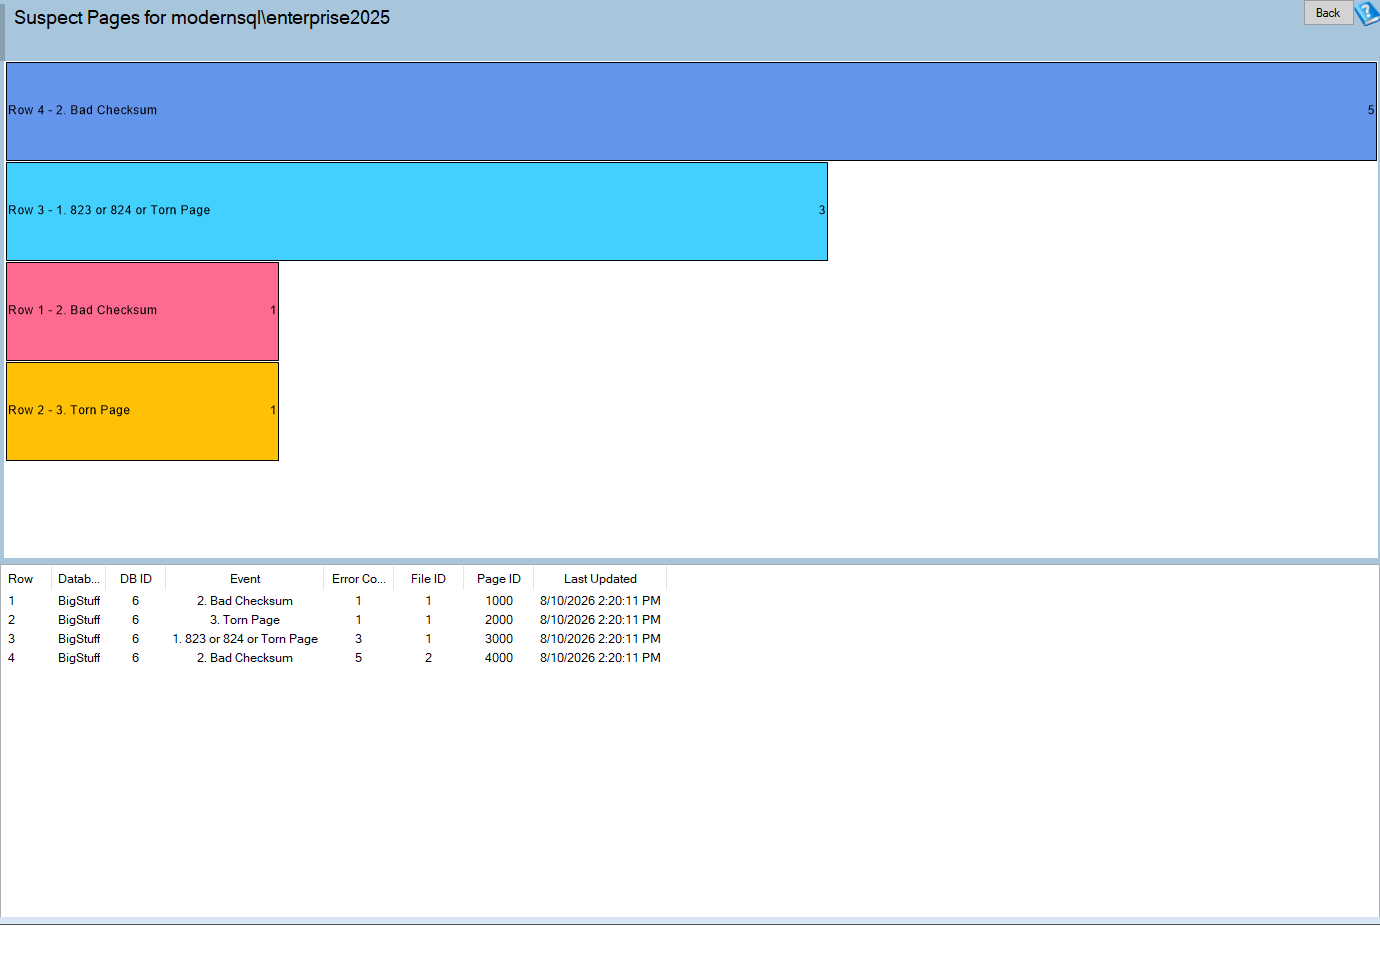
Suspect Pages is one of the reports in Database Health Monitor. It runs against your own servers, and it takes about a minute to have this same screen open on one of them.
Where the SQL Server Suspect Pages Report Fits
This report turns that table into something a person can scan in a few seconds. Each bar is one row, its length set by how many times a page has been recorded, so one long bar marks a page something keeps trying and failing to read. Rows sort by when they were last written, newest first, because a fault from last night and one from four years ago are not the same conversation.
None of this changes anything on its own. Every real fix, a restore or a 'DBCC' repair, is a command with real consequences, which is exactly why the page only shows what happened and leaves the decision to a person.
Reading the Grid
Underneath the chart sits a plain grid: database, database ID, event, error count, file ID, page ID, last updated. The database ID matters more than it looks, because a dropped or detached database resolves to a blank name, leaving the ID as the only thing pointing at what it used to be. File ID and page ID are what a later 'DBCC PAGE' call or a 'CHECKDB' run turns into an actual table name; the grid on its own does not make that connection.
| Event | What it tells you |
|---|---|
| 823, 824 or torn page | A general read failure, the most common entry |
| Bad checksum | The page changed after it was written, a storage fault |
| Torn page | An incomplete write, often a power loss mid-write |
| Restored or repaired | A later row means somebody already dealt with it |
| Deallocated | Data on that page was thrown away on purpose |

What to Do When It Isn't Empty
- Take a backup immediately, while the database is still readable
- Check the error log for '823', '824' and '825' entries around the same time
- Run 'DBCC CHECKDB' to learn the real extent of the damage
- Confirm the log chain is unbroken before counting on a page level restore
- Look past the database at the disk or controller underneath it
This is a pattern we see often enough across client servers to be worth naming. One row, one bad checksum, months old, with nothing since, is usually a storage glitch that already resolved itself. Several rows in the same database over a few days tell a different story, typically a failing disk or a failing controller, and it is worth checking whether the same volume shows up elsewhere on the instance. What it actually costs is rarely the storage itself. It is the restore that has to happen under pressure, on a weekend, because nobody was watching this table on the Tuesday the first row appeared.
The Table Doesn't Clean Itself
Two things about this table catch people out. It holds a maximum of 1000 rows, so on an instance with a genuinely failing disk it can go quiet while the problem keeps happening underneath. And nothing removes old rows on its own: a fault fixed three years ago is still sitting there next to whatever happened last night. Nothing here raises an alert either, which matters if you are counting on notifications to catch problems generally. Why Your SQL Server Alert History Is Full of Noise covers a different reason alerts get missed, but the lesson is the same: this table does not page anyone, so somebody has to go looking.
One more distinction worth keeping straight: a suspect page is not the same thing as a corrupt database. It is one page the engine could not read correctly, and 'DBCC CHECKDB' is what actually tells you whether the database as a whole is still consistent. Treat this table as the smoke detector, not the fire report.
What to check on your own server
- Query msdb..suspect_pages this week and confirm it comes back empty
- Check when DBCC CHECKDB last completed successfully against each production database
- Confirm every database that needs it is in FULL recovery with an unbroken log chain
- Read the error log for any 823, 824 or 825 entries from the last month
- Delete rows for pages already restored or repaired so the table only shows current problems
Try Database Health Monitor Today
It surfaces the damaged pages SQL Server already recorded in msdb but never alerted anyone to, so a failing disk is caught before it takes the database down. Database Health Monitor shows it on every instance you connect, in the time it takes to open the report.
Download Database Health Monitor and run the Suspect Pages report against your own server. There is nothing to configure first, and you will know inside a few minutes whether it tells you something you did not already know.