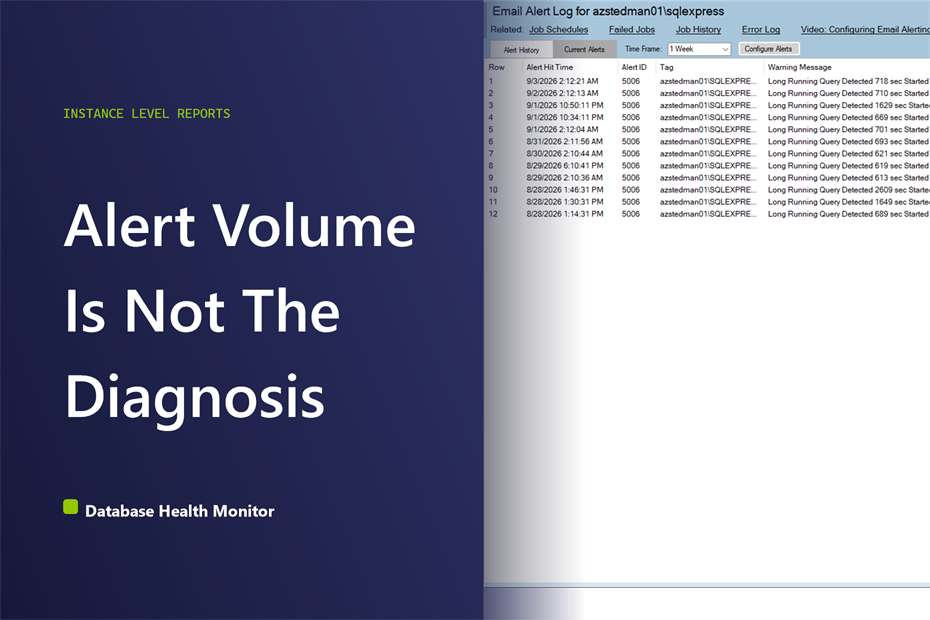
Every DBA inbox tells some version of the same story. Fourteen warning emails overnight about a drive that has been full since Tuesday. One alert that supposedly fired three weeks ago and, as far as anyone can tell, never actually stopped. Sooner or later somebody scrolls back through the alert history looking for a pattern, gives up half way down the list, and just silences the rule instead.
How do you read SQL Server alert history to tell a bad alert from a real problem? Alert history is the record Database Health Monitor keeps of every alert that has fired for a SQL Server instance: the rule, what it fired about, and the message sent. Reading it means grouping rows by Alert ID and by Tag, because that separates a genuinely bad alert threshold from one database or drive causing the noise.
Why the Inbox Lies About What's Wrong
The instinct is to count. Thirty warning emails this week feels like thirty problems, so the natural move is to mute whichever rule sent the most mail, or push its threshold up until it stops complaining. That number is honest about volume and dishonest about cause. A single alert rule with a threshold that is simply wrong looks, from an inbox, exactly like five different databases each having a genuinely bad week, because every message carries the same subject line and the same alert name. Muting the loudest rule can just as easily silence the only warning you had about a drive that is about to fill.
What the Email Alert Log Puts on Screen
Database Health Monitor keeps a running record of every alert it has ever sent for an instance, and a separate view of what is active right now, on one page called the Email Alert Log. It lives under Instance Level Reports, on the server's right-click menu, and the title bar confirms which server you are looking at before you read another row.
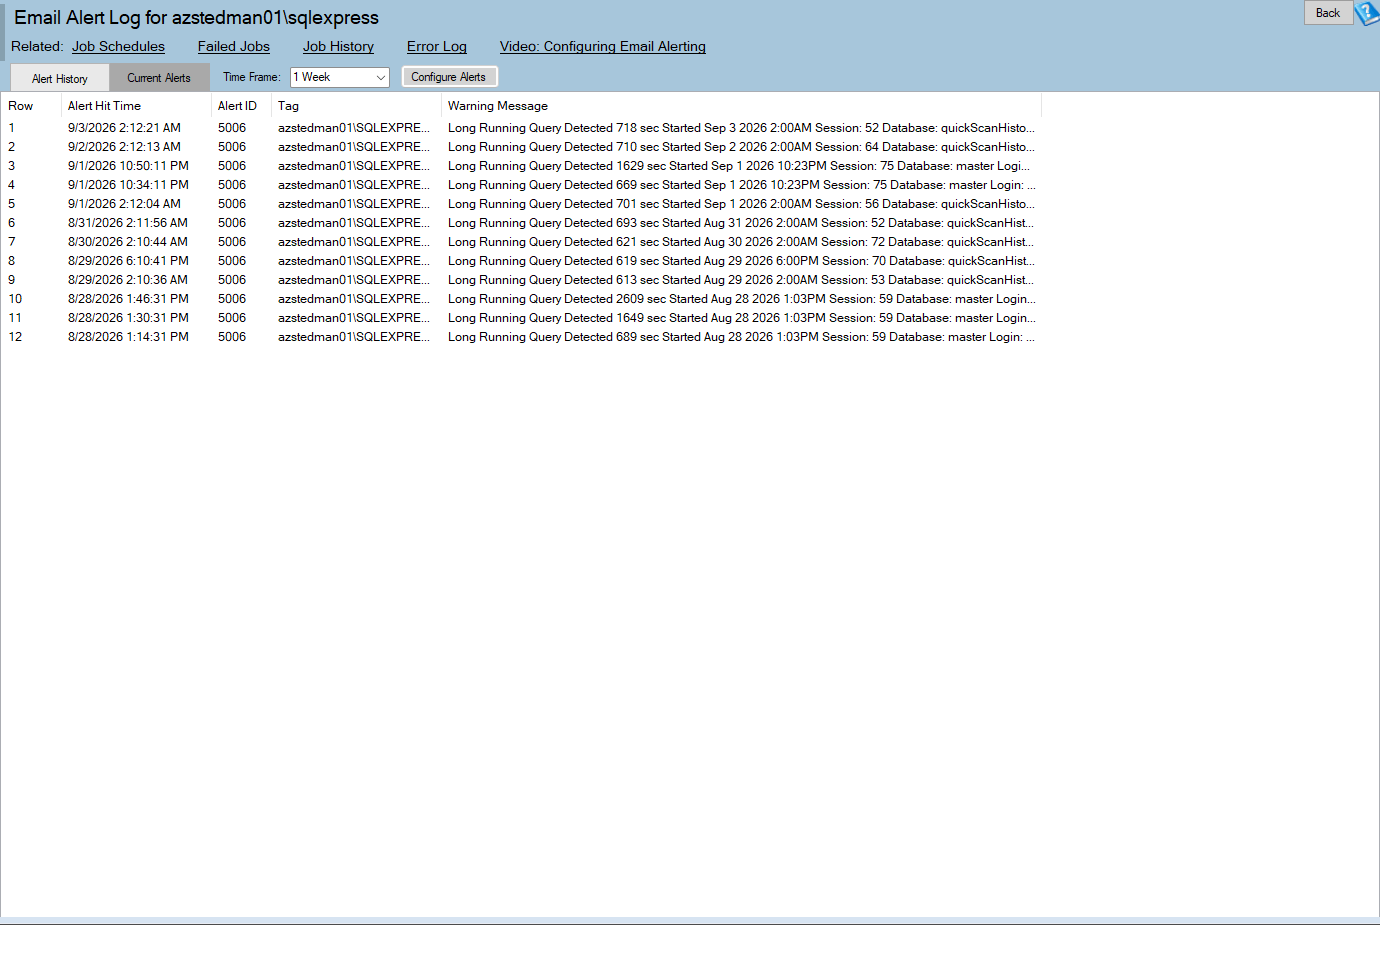
Email Alert Log is one of the reports in Database Health Monitor. It runs against your own servers, and it takes about a minute to have this same screen open on one of them.
| Column | What it tells you |
|---|---|
| Alert Hit Time | When that particular alert fired |
| Alert ID | Which configured rule fired |
| Tag | The database, drive, or job the alert was actually about |
| Warning Message | The text of the message that went out, stripped of its HTML |
Underneath, this is two tables: +MailReportingHitLog+ for what fired, and +MailReportingCheckTracker+ for what is still active. Current Alerts joins the two, which is why an active alert with nothing in the hit log yet still shows up, just with a couple of blank columns.
Reading the Alert History Without Getting Lost
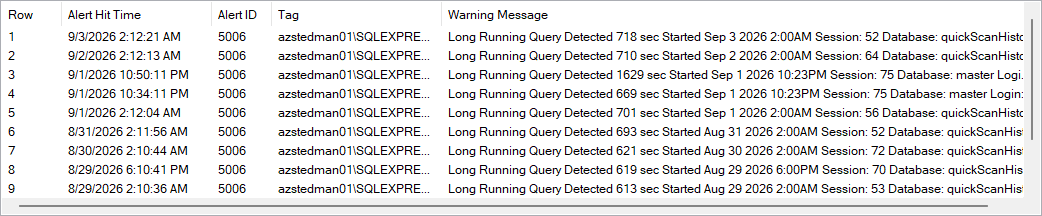
Group by Alert ID first, then by Tag. The tab opens on the last week, which is rarely enough to judge anything by; widen it to a month before drawing conclusions about volume. Once the rows are in front of you, sort them in your head twice: first by Alert ID, to see whether one rule accounts for most of what fired, and then by Tag, to see whether one target accounts for most of that rule's rows. A bad threshold and a database in genuine trouble produce identical looking inboxes, and completely different pictures, once you make that second pass.
Current Alerts and the One That Won't Clear
Current Alerts drops the time frame entirely, because there is nothing to choose a window over: a condition is either true right now or it is not. Alert Status shows red for alerting and green for resolved. The column worth understanding before any other is Next Alert Time, the anti-spam interval at work, the point at which a still-true condition is allowed to send another message. Seeing a future time there on something you already fixed is expected, not broken; the row clears once the next run confirms the condition is actually gone. A red row with a Last Hit Time from three weeks back is a different problem: the condition came and went, and nothing ever told the system to stop calling it active.
Clearing an Alert Doesn't Fix It
Right-click a row and the options depend on the tab and the state. Clear Alert only appears on an ALERTING row, and it does one thing: resets that alert and tag to not-active, leaving the history of it firing untouched. Delete removes rows outright, on either tab, and Delete All Entries on the History tab only removes what the current time frame is showing, not everything that has ever fired.
None of that touches the cause. If the underlying condition is still true, the next alerting run marks the row active again and sends another message, so clearing only belongs after the cause has actually been handled. A button right there on the page opens the threshold, the recipients, and the repeat interval for every rule on this instance, which is where the fix, as opposed to the acknowledgment, actually happens.
Patterns Worth Recognizing
- One alert, one tag, and hundreds of rows: a condition that has been true for a long time paired with an interval set too short to matter
- A red row with an old Last Hit Time: the condition cleared and nothing marked it resolved
- A run of alerts at the same time every night: maintenance work crossing a threshold that was never set with maintenance in mind
- A full history and an empty Current Alerts tab: alerting doing exactly what it was built to do
What to check on your own server
- Check whatever is currently alerting on your instance and treat anything still active as something to explain today
- Pull at least a month of alert history and group it by rule, not by the day it happened
- Note which single database, drive, or job accounts for most of one rule's alerts
- Clear or acknowledge only the alerts whose underlying condition has actually been resolved
- Adjust the threshold or repeat interval on whichever rule produced the most rows this month
Try Database Health Monitor Today
It turns a flooded inbox and a mystery ALERTING row into two short lists you can actually act on. Database Health Monitor shows it on every instance you connect, in the time it takes to open the report.
Download Database Health Monitor and run the Email Alert Log report against your own server. There is nothing to configure first, and you will know inside a few minutes whether it tells you something you did not already know.