Welcome to our latest exploration into the world of database management and optimization. Today, we’re diving into a powerful tool for database administrators: visualizing SQL Agent Job History with the help of Database Health Monitor. SQL Agent Jobs are crucial for automating routine tasks in SQL Server environments, but tracking their performance and identifying issues can be a daunting task without the right tools. By leveraging the visualization capabilities of Database Health Monitor, we can transform raw job history data into insightful, easy-to-understand graphics that reveal trends, bottlenecks, and potential failures at a glance.
In this post, we’ll walk through the process of utilizing Database Health Monitor to create meaningful visualizations of SQL Agent Job History. Whether you’re a seasoned DBA or just starting to manage SQL Server environments, understanding the health and performance of your automated jobs is essential for maintaining a smooth and efficient system. Stick with us as we break down the steps to harness this tool and turn complex data into actionable insights that can save time and prevent costly downtime.
A 24-Hour View of SQL Agent Jobs
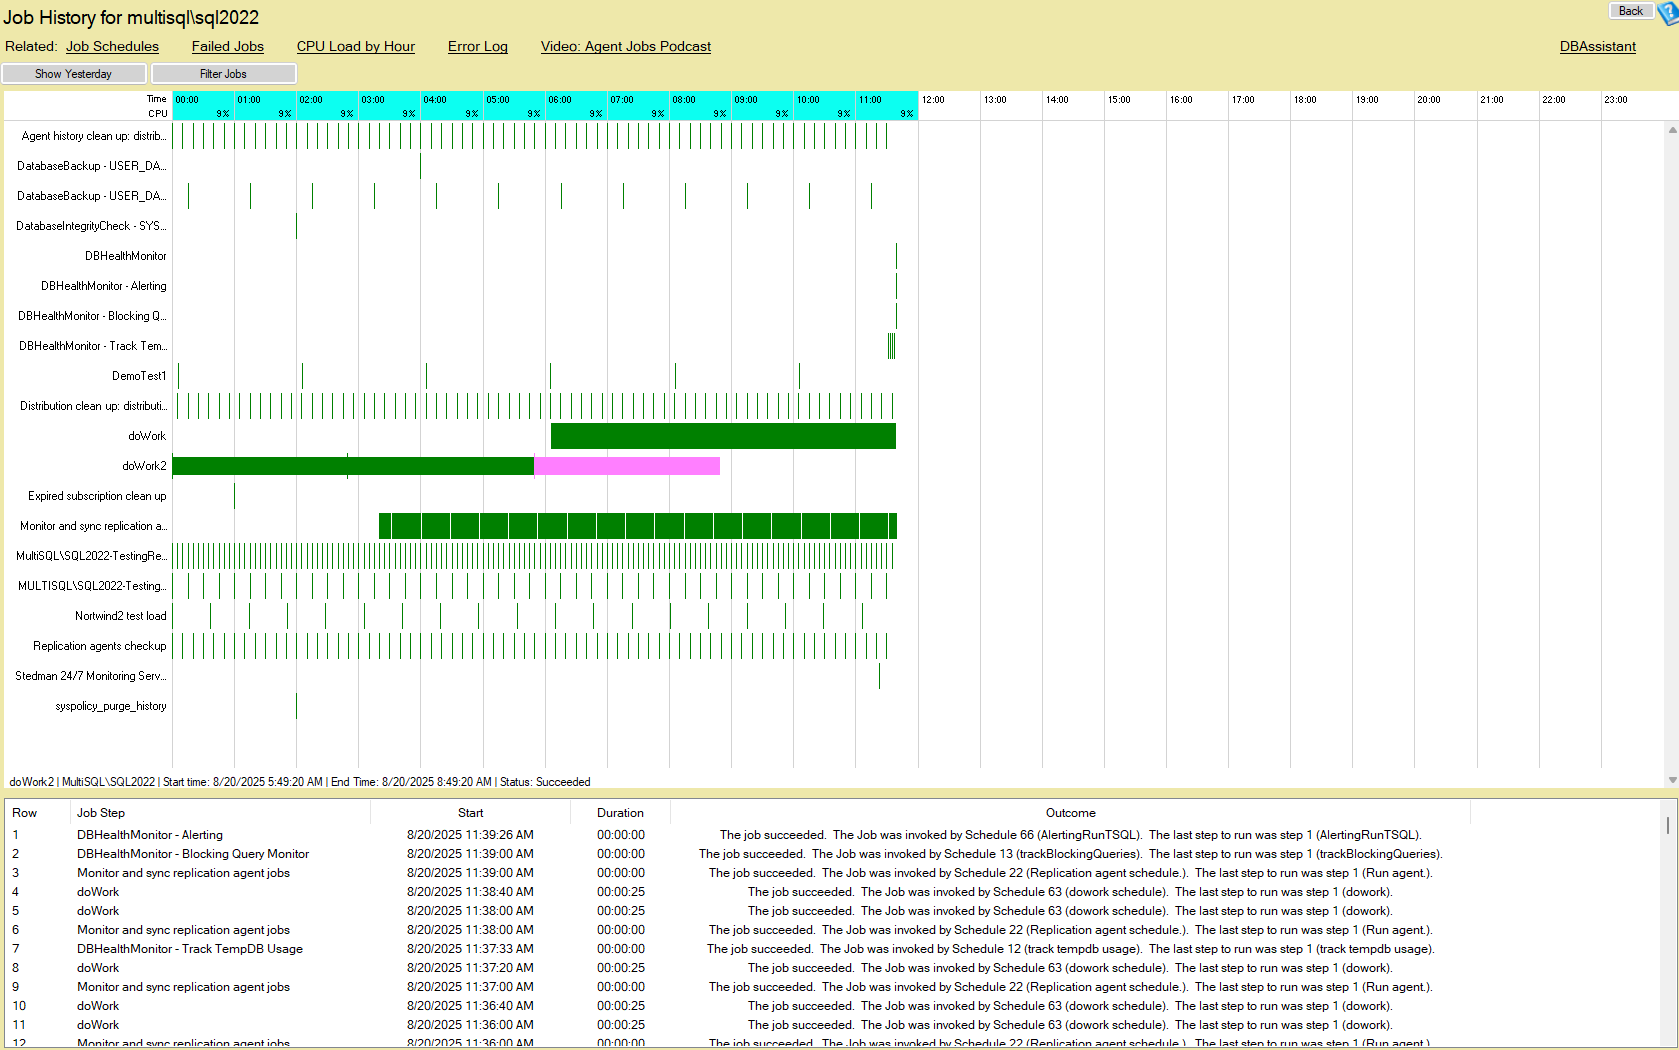
The Job History report is an instance-level report that shows the last 24 hours of SQL Agent job activity in a clear, visual timeline.
- Green bars represent successful jobs.
- Red bars represent failed jobs.
- Hovering over a job reveals detailed start and end times, which are also shown at the bottom of the graph.
This view lets you quickly see when jobs start, how long they run, and where they overlap and contend for resources. Need to step back another day? Use the Show Yesterday button to review the previous 24 hours.
Filtering for What Matters Most
Busy servers can have dozens or hundreds of jobs. The Job History report includes filtering so you can focus on the specific jobs you care about. Select the jobs you want shown and hide the rest to answer questions like:
- How long did last night’s ETL job really take?
- When exactly did the backup jobs finish?
- Is index maintenance overlapping with reporting windows?
CPU Load Awareness
At the top of the graph you’ll see the average CPU usage recorded during each hour. This context is invaluable when planning new jobs or rescheduling existing ones. If CPU is consistently high at a certain hour, consider shifting work to a quieter window. If jobs run long during peak CPU, you’ve found a bottleneck to address.
List View for Detail
Beneath the timeline is a list view showing a text version of job history: start time, duration, and outcome. Use the graph to spot patterns at a glance, then use the list for the precise details needed for auditing and troubleshooting.
Use It Per Instance or Across Your Estate
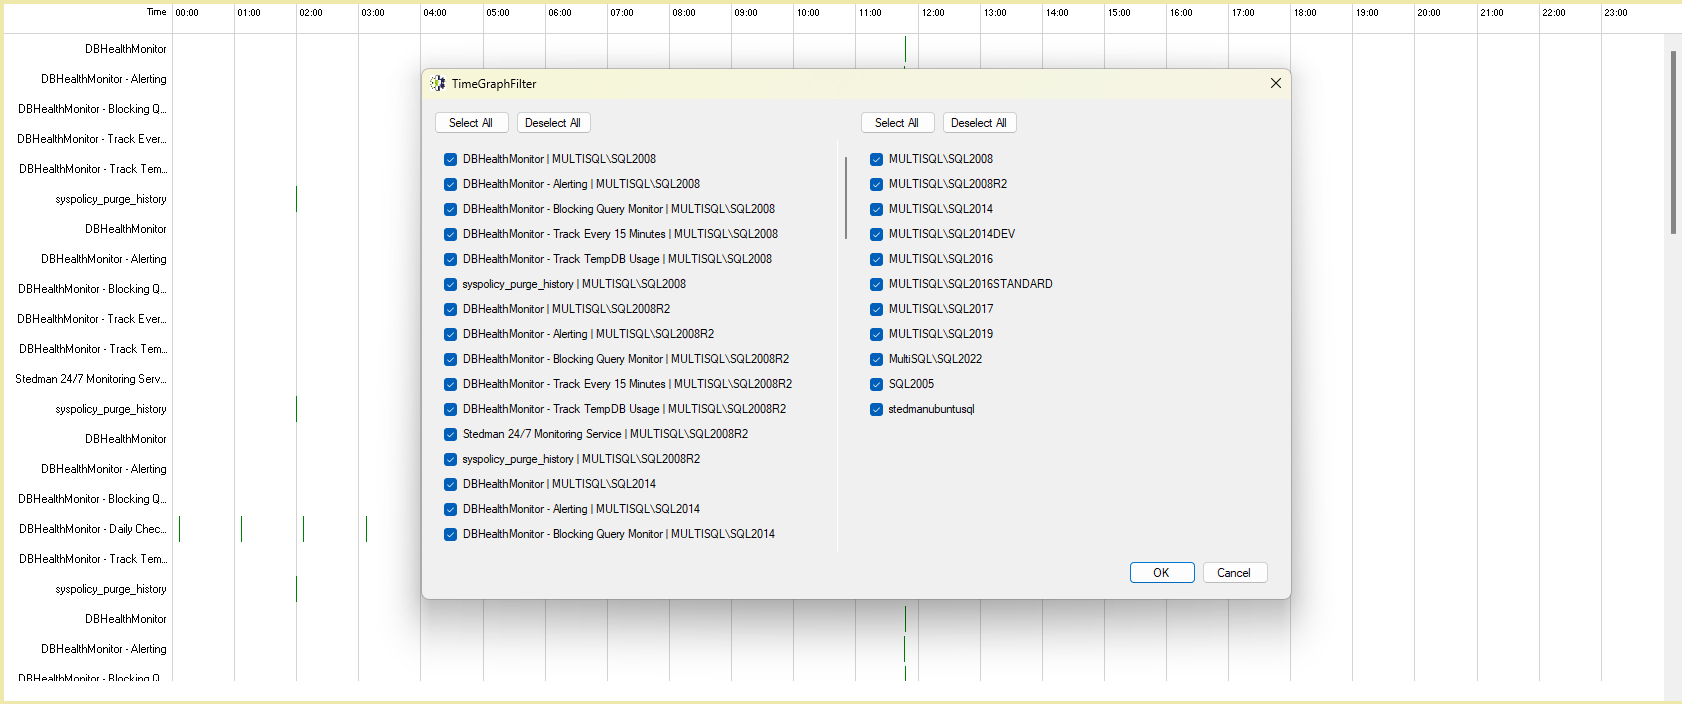
Job History is available from the Server Overview for a single instance. It’s also available from the Server Health start tab, where you can run it against all registered instances. This broader view includes filtering so you can choose which instances to include on the chart—perfect for DBAs responsible for multiple servers.
Put the Job History Report to Work
SQL Agent jobs are the backbone of most SQL Server environments—handling backups, index maintenance, ETL processes, reporting refreshes, and more. If you’re not keeping a close eye on when these jobs run, how long they take, and whether they succeed, you’re leaving your environment at risk.
The Job History report in Database Health Monitor is more than a visual. Use it to:
- Spot failures before they impact the business.
- Identify scheduling conflicts that waste resources.
- Align job schedules with real CPU load patterns.
- Validate that maintenance and mission-critical jobs run as expected.
Don’t just set up jobs and hope for the best—use the Job History report to take control of them.