Database Health Monitor can help track your top SQL Server performance metrics.
SQL Server Performance Metrics: The Key Indicators You Should Be Tracking
Performance tuning in SQL Server is often an art, but it starts with science: understanding and monitoring the right metrics. Keeping an eye on critical performance metrics helps ensure your SQL Server runs smoothly, avoids bottlenecks, and delivers a great experience for end users.
In this blog post, we’ll explore the top SQL Server performance metrics you should track, and how Database Health Monitor can make it easier to monitor and understand these metrics.
Why SQL Server Performance Metrics Matter
A poorly performing SQL Server can lead to slow applications, frustrated users, and missed business opportunities. Key metrics highlight areas of inefficiency and guide you toward solutions—whether it’s optimizing queries, fixing indexing problems, or addressing server resource issues.
With tools like Database Health Monitor, you can view, analyze, and act on these metrics before they become a problem.
Top SQL Server Performance Metrics to Monitor
1. Wait Statistics
Wait statistics tell you where SQL Server is spending time waiting. Common wait types include:
- PAGEIOLATCH_XX: Indicates slow disk I/O.
- CXPACKET: Points to parallelism inefficiencies.
- SOS_SCHEDULER_YIELD: Signals CPU contention.
How Database Health Monitor Helps:
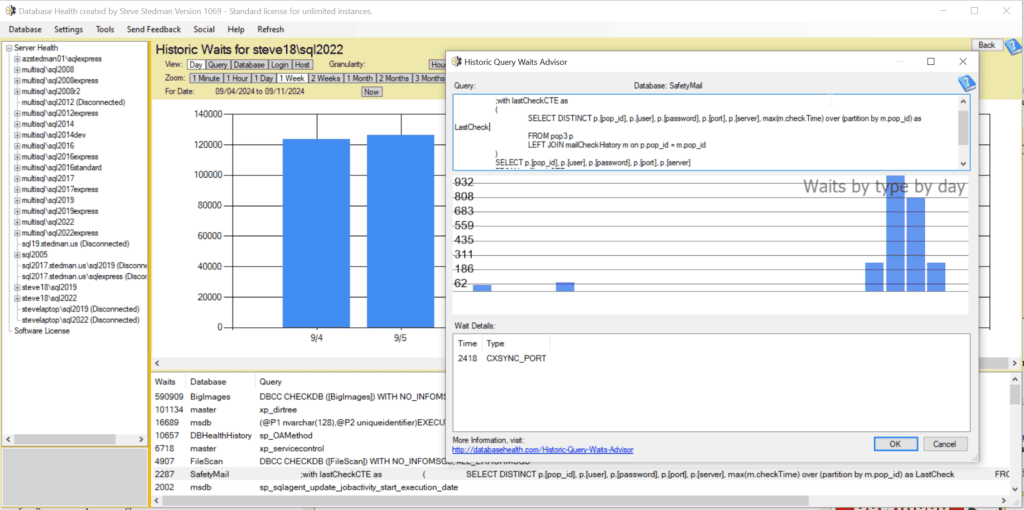
Database Health Monitor includes a Waits by Day report, which helps you identify and analyze top wait types in your system. This allows you to focus on the areas causing the most delay.

2. Query Performance (Execution Plans and Query Time)
Queries are often the main culprit behind performance issues. Metrics to track include:
- Query execution time.
- Number of reads and writes per query.
- Missing or unused indexes.
How Database Health Monitor Helps:
The Missing Indexes Advisor feature flags missing, unused, and duplicate indexes. It also highlights expensive queries and suggests ways to optimize them.

3. Index Usage and Fragmentation
Indexes speed up data retrieval, but they can degrade if overused or fragmented. Metrics to monitor include:
- Index fragmentation levels.
- Unused indexes (wasting resources).
- Missing indexes (causing unnecessary full table scans).
How Database Health Monitor Helps:
The Index Fragmentation report in Database Health Monitor shows fragmentation across your tables and recommends rebuilding or reorganizing indexes as needed.

4. CPU Usage
High CPU utilization can indicate resource bottlenecks or poorly written queries. Key CPU-related metrics include:
- Average CPU usage over time.
- High CPU-consuming queries.
How Database Health Monitor Helps:
Use the Performance Dashboard to visualize CPU usage trends and identify the queries or processes consuming the most CPU resources.

5. Disk I/O
Disk I/O performance affects query speed, especially for large data sets. Important metrics include:
- Read/Write Latency.
- IOPS (Input/Output Operations Per Second).
How Database Health Monitor Helps:
The Server Overview dashboard highlights I/O patterns and any latency issues, making it easier to spot storage bottlenecks.

6. Memory Usage
Memory pressure can cause SQL Server to rely on disk instead of faster RAM. Monitor these metrics:
- Buffer cache hit ratio (should be high).
- Page life expectancy (should be long).
- Memory grants pending (indicates insufficient memory).
How Database Health Monitor Helps:
Database Health Monitor includes a Memory Usage view, showing trends and helping pinpoint whether your server has adequate memory.

7. Blocking and Deadlocks
Blocking and deadlocks happen when processes wait on each other, slowing down transactions. Metrics to track:
- Blocked sessions.
- Deadlock frequency and impacted queries.
How Database Health Monitor Helps:
The Blocking Queries feature displays real-time blocking events, so you can quickly resolve the issues causing delays.

8. TempDB Usage
TempDB is a shared resource in SQL Server and is often a performance bottleneck. Metrics to watch:
- TempDB contention.
- Space utilization.
How Database Health Monitor Helps:
The TempDB Monitoring section provides insights into file contention and overall TempDB health, ensuring optimal configuration.

Why Choose Database Health Monitor?
Tracking these metrics manually is time-consuming and prone to error. Database Health Monitor offers:
- Real-time monitoring: Get instant insights into your SQL Server performance.
- Automated analysis: Flag issues like high wait times or inefficient indexes.
- Historical data: Spot trends over time for proactive tuning.
- Free to use: A cost-effective solution for DBAs and developers.
Database Health Monitor brings together the most critical performance metrics in a single, easy-to-use tool, helping you stay ahead of problems and maximize your SQL Server’s potential.
Proactive SQL Server Management with Stedman Solutions
While Database Health Monitor is a fantastic tool, having experts by your side ensures you’re not just spotting problems but solving them efficiently. At Stedman Solutions, we specialize in SQL Server performance tuning. Our Managed Services include:
- Continuous performance monitoring.
- Expert advice for resolving bottlenecks.
- Free access to our courses and mentoring.
Contact us today to learn more! 👉 Contact Stedman Solutions
Start tracking your SQL Server performance metrics with Database Health Monitor, and let us help you achieve the high-performing SQL Server environment your business needs!
