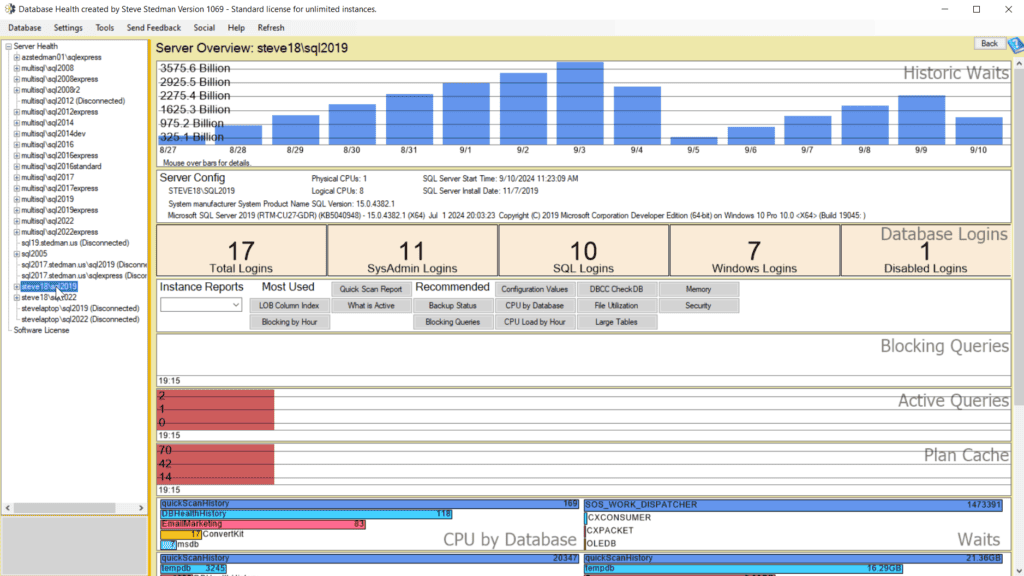
Database Health Monitor Main Page

Exploring the Main Application Window of Database Health Monitor
When you first open Database Health Monitor, you’re greeted with a comprehensive yet intuitive interface designed to give you all the tools you need to monitor and manage your SQL Server connections and environment effectively. Today, we’ll take a closer look at the main application window and explore its key components, including the treeview on the left and the detailed overview for each server.
The Server List Tree View: Your Command Center for Server Connections
On the left side of the application window, you’ll find the Server List Tree View, which serves as your command center for navigating through your SQL Server connections. This treeview is organized hierarchically, allowing you to quickly access different servers, databases, and specific reports.
- Server Connections: At the top level of the treeview, you’ll see all the SQL Server instances you’ve connected to. Expanding a server node reveals more detailed options for that instance.
- Databases: Under each server connection, you can drill down into individual databases, where you can access database-specific reports and configurations.
- Reports and Tools: For each server or database, the treeview provides easy access to a wide range of reports and tools, which we’ll explore in more detail below.
The Overview: A Snapshot of Your Server’s Health
Once you select a server from the treeview, the right side of the application window populates with a detailed Overview of that server. This overview is designed to provide a quick yet comprehensive snapshot of your server’s health and performance. Here’s what you can expect to see:
- Wait Stats:
- A visual breakdown of the wait statistics for your server. This is crucial for identifying performance bottlenecks and understanding where your SQL Server might be struggling.
- Server Configuration:
- Detailed information about your server’s configuration settings, including memory settings, max degree of parallelism, and other critical parameters. This helps ensure your server is configured for optimal performance.
- Database Logins:
- A list of all logins for your SQL Server, helping you manage access control and security across your databases.
- Instance-Level Reports:
- Access various instance-level reports directly from the overview, including reports on CPU usage, memory, I/O, and more. These reports provide deep insights into your server’s performance at a glance.
- Blocking Queries:
- A real-time view of any blocking queries on your server. This feature is essential for identifying and resolving issues that can cause significant slowdowns.
- Active Queries:
- See a list of all currently active queries, along with their execution details. This is useful for tracking down queries that might be consuming excessive resources.
- Plan Cache:
- Analyze the plan cache to identify query plans that might need optimization. This helps in fine-tuning the performance of your queries.
- Waits CPU by Database:
- A report that breaks down CPU usage by database, helping you identify which databases are consuming the most resources and might need attention.
- And Many More Reports:
- The overview window provides access to numerous other reports, including missing indexes, index fragmentation, backup status, and more. Each report is designed to give you actionable insights into different aspects of your SQL Server environment.
Customizing Your Experience
One of the strengths of Database Health Monitor is its flexibility. The main application window allows you to customize your experience, whether you’re focused on a single server or managing multiple instances. You can resize panels, undock windows, and arrange the interface to suit your workflow.
Conclusion: Your SQL Server, Under Control
The main application window of Database Health Monitor is designed to give you a powerful yet user-friendly interface for managing your SQL Server environment. With the treeview providing easy navigation and the overview offering in-depth insights, you’ll have all the tools you need to ensure your SQL Server is running smoothly.
Ready to take control of your SQL Server performance? Download Database Health Monitor today and start exploring these features for yourself.