
Identifying TempDB Bottlenecks with Database Health Monitor Reports
SQL Server’s TempDB is a crucial system database that supports temporary storage needs for the SQL Server instance, including temporary tables, table variables, and work files necessary for sorting and query processing. However, TempDB can become a performance bottleneck if not properly managed, especially in high transaction environments. Fortunately, tools like the Database Health Monitor offer insightful reports, such as TempDB IO by Hour, TempDB Usage by Hour, and TempDB High Usage, to diagnose and pinpoint issues. In this blog post, we’ll explore how combining these reports can help determine if TempDB is your bottleneck and if a poorly performing query is the root cause.
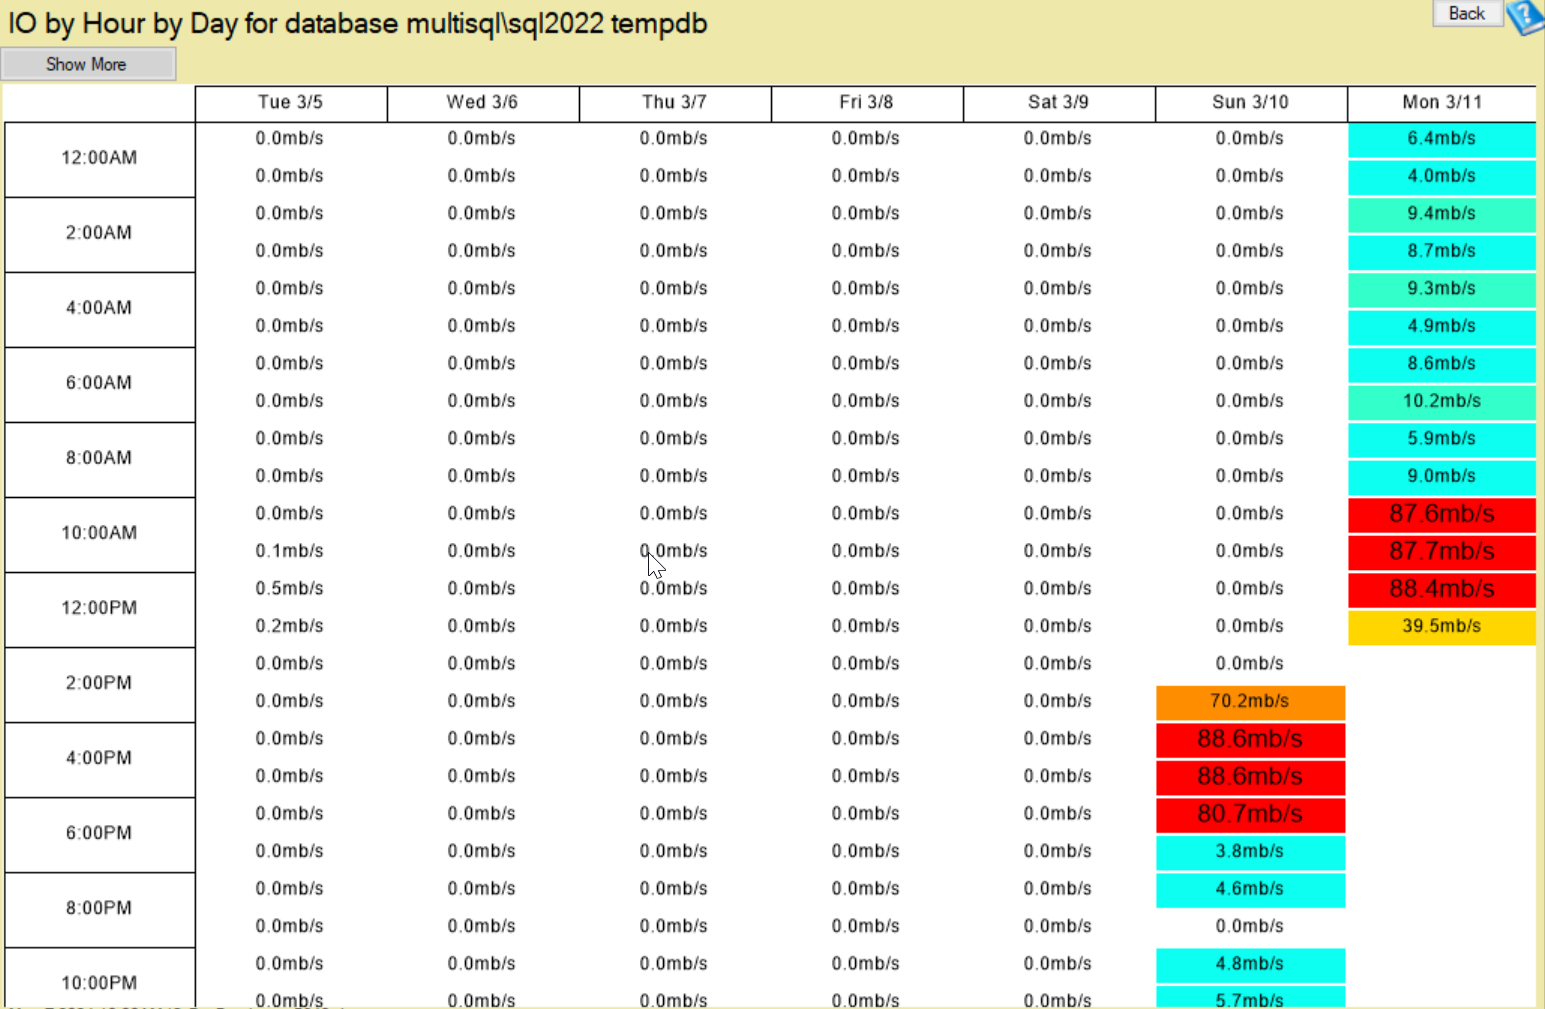
TempDB IO by Hour Report
The TempDB IO by Hour report provides a granular look at the input/output operations within TempDB across different times of the day. High IO operations can indicate heavy TempDB usage, which might be a sign of certain queries or processes putting a strain on system resources. By analyzing patterns of high IO activity, DBAs can identify specific times when performance issues are most likely to occur.
TempDB Usage by Hour
While the TempDB IO by Hour report focuses on IO operations, the TempDB Usage by Hour report sheds light on the overall usage patterns of TempDB. This includes space allocation by temporary objects and version stores, offering a comprehensive view of how and when TempDB space is utilized. Spikes in TempDB usage can correlate with certain processes or queries that require significant temporary storage, guiding DBAs towards potential optimization opportunities.
TempDB High Usage Report
The TempDB High Usage report takes the analysis a step further by highlighting instances of exceptionally high usage, which could signal immediate or impending performance issues. This report is instrumental in identifying outlier events where TempDB usage exceeds typical operational thresholds, potentially impacting overall SQL Server performance.
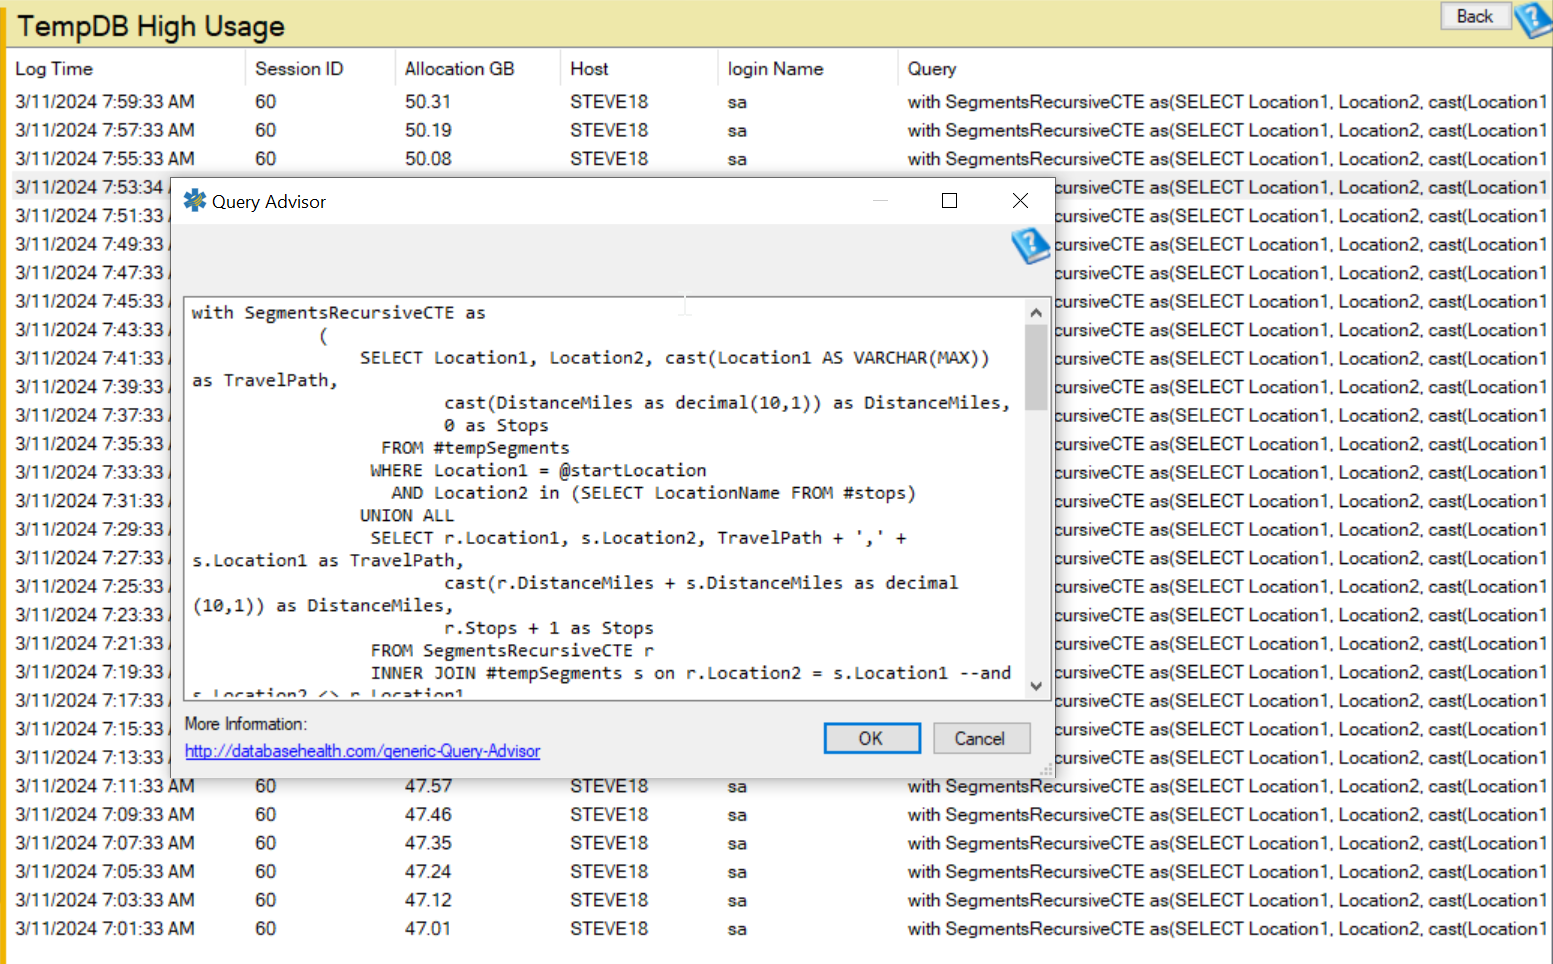
I was able to find a single CTE query that was using around 50GB of TempDB. No wonder it was taking so long to run.
Combining Insights to Identify Bottlenecks
By integrating insights from these three reports, DBAs can form a holistic view of TempDB’s performance landscape:
- Identify High IO and Usage Patterns: Start by identifying times when IO operations or TempDB usage spike. These patterns can help pinpoint when the system is under the most stress.
- Correlate with High Usage Events: Compare these patterns with instances of high usage reported. If high IO operations or significant TempDB usage align with reported high usage events, it’s indicative of TempDB being a performance bottleneck.
- Drill Down to Query Level: Once a temporal correlation is established, the next step involves drilling down into the queries executed during those times. This can involve examining execution plans, query texts, and session history to identify the specific queries contributing to high TempDB usage.
- Optimization and Testing: After identifying the problematic queries, the focus shifts to optimization. This can include rewriting queries, adjusting indexes, or considering schema changes. Subsequent monitoring will be crucial to assess the impact of these optimizations on TempDB performance.
Conclusion
The TempDB IO by Hour, TempDB Usage by Hour, and TempDB High Usage reports in the Database Health Monitor are invaluable tools for diagnosing TempDB performance issues. By offering detailed insights into IO operations, usage patterns, and peak usage events, these reports enable DBAs to pinpoint potential bottlenecks linked to poor query performance. Armed with this information, targeted optimizations can be implemented to alleviate stress on TempDB, enhancing overall SQL Server performance and stability. Remember, regular monitoring and proactive management of TempDB are key to maintaining a healthy and high-performing SQL Server environment.